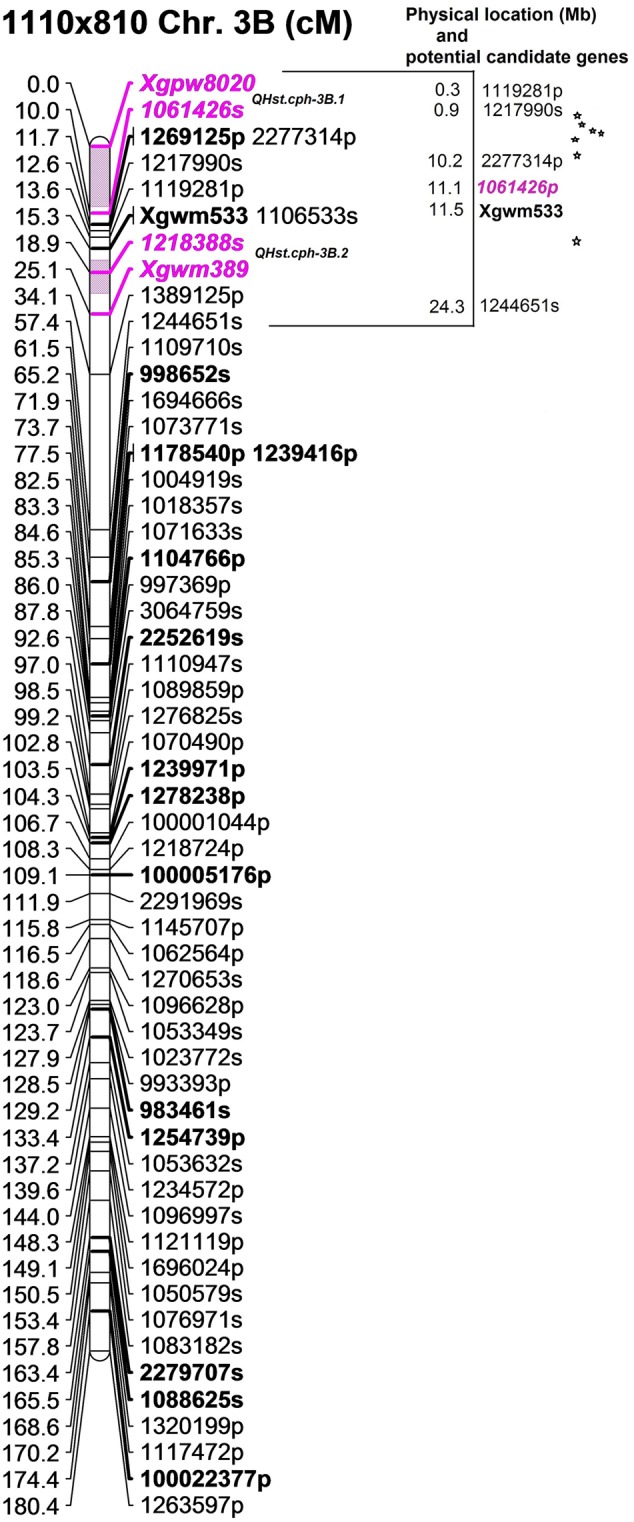
FIGURE 3.

The position of the identified two QTLs (QHst.cph-3B.1 and QHst.cph-3B.2) on chromosome 3B in the population 1110 × 810. The genetic map was created using 140 F2 genotypes. Only the markers with unique position (cM) are shown except at the flanking positions. Markers with a suffix “s” (denoting SNP) and “p” (denoting PAV) are DArTseq markers while markers with prefix “Xgwm” and “Xgpw” are SSR markers. The QTL region defined by one-LOD drop off interval is marked in color and the two flanking markers of the QTL peak are marked bold and Italics. Other bold markers indicate the common markers that were also mapped in the population 1110 × 1313. The corresponding approximate physical location (Mb) of the QTL region is indicated and each star within this region indicates a potential candidate gene having a known function.
