
Figure 1.
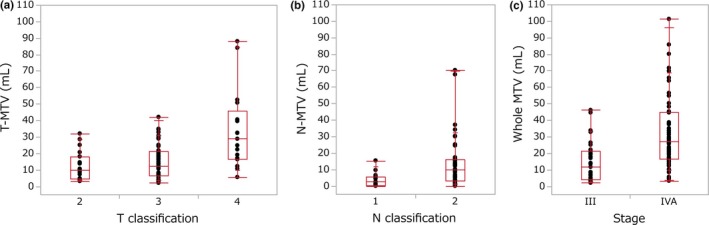
(a) Metabolic tumor volume (MTV) of primary tumor as a function of T classification. (b) Metastatic nodal MTV as a function of N classification. (c) Whole MTV as a function of TNM stage. Each box contains the center 50% of MTV for each classification or stage. Bar within the box indicates the median. Solid lines extending above and below each box indicate the range of MTV. Each dot represents an individual MTV.