Figure 2.

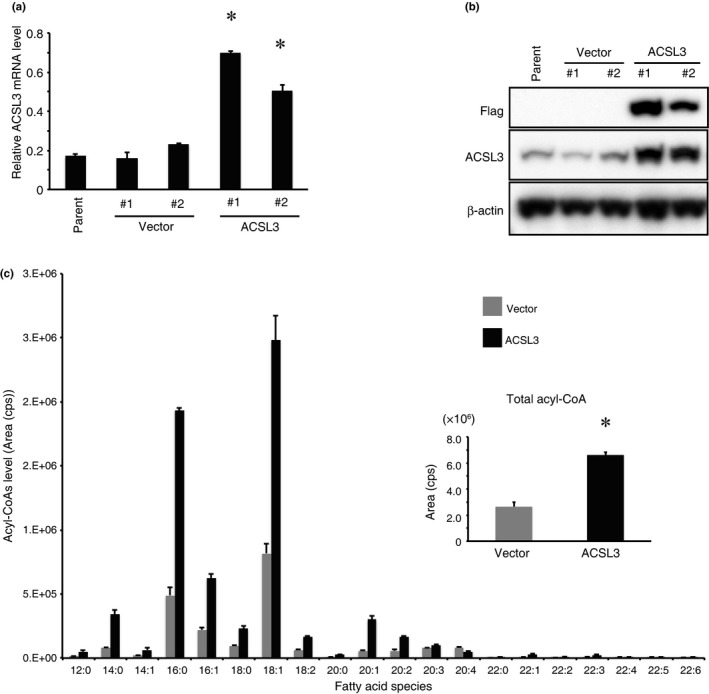
ACSL3 overexpression promotes acyl‐CoA production. (a) ACSL3 mRNA levels were quantified by real‐time PCR in parental vector control (LNCaP‐vector #1 and #2) or ACSL3‐overexpressing LNCaP (LNCaP‐ACSL3 #1 and #2) cells. The data were normalized to that of β‐actin. Differences between LNCaP‐vector and LNCaP‐ACSL3 cells were analyzed for statistical significance. *P < 0.05. (b) ACSL3 and FLAG protein levels in parental LNCaP, LNCaP‐vector, and LNCaP‐ACSL3 cells were measured by immunoblotting using antibodies against FLAG and ACSL3. β‐actin was used as a loading control. (c) Lipids were extracted from LNCaP‐vector (grey bar) and LNCaP‐ACSL3 (black bar) cells, and acyl‐CoA levels in each fatty acid species were measured by liquid chromatography tandem mass spectrometry (LC‐MS/MS). Horizontal axis: C12:0‐C22:6. Data of each fatty acid species were summed up for total levels of acyl‐CoA (small bar graph). Differences between LNCaP‐vector and LNCaP‐ACSL3 cells were analyzed for statistical significance. *P < 0.05.
