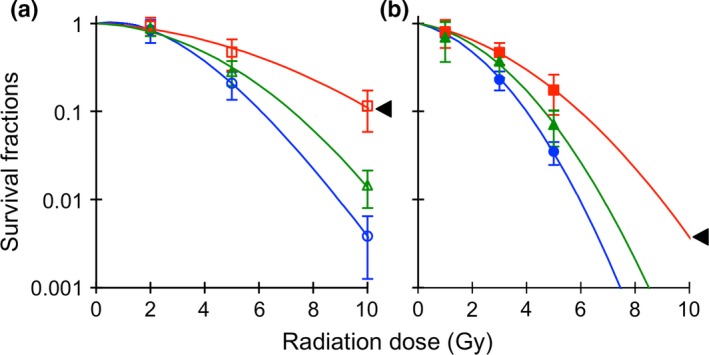
Figure 1.

Difference in X‐ray (a) and C‐ion (b) sensitivity between NR‐S1, X60 and C30 cells. The blue, red and green lines show survival curves of NR‐S1, X60 and C30 cells, respectively. The triangles indicate statistical difference with respect to the survival curve of NR‐S1 cells (anova, P < 0.05).
