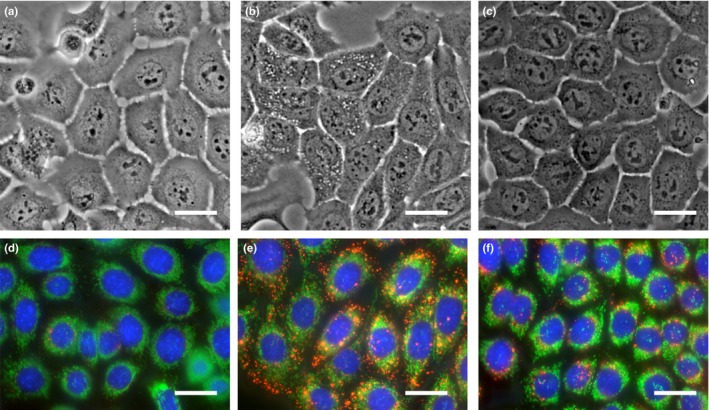
Figure 2.

Morphological difference between NR‐S1 (a, d), X60 (b, e) and C30 (c, f). Upper panels (a–c) show images under bright light in normal culture conditions. Lower panels (d–f) show fluorescence image of lysosome, mitochondria and nucleus, which are stained in red, green and blue, respectively. The scale bars indicate 25 μm.
