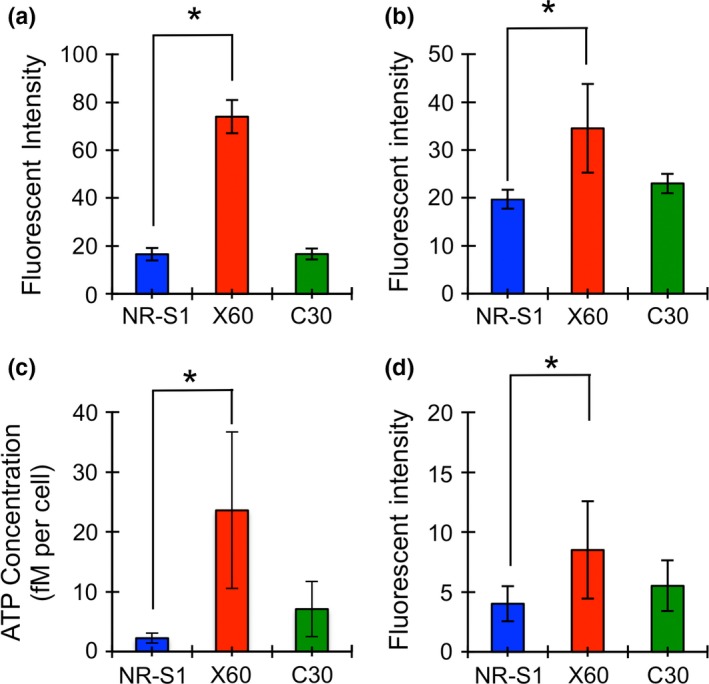
Figure 3.

Amount of lysosome (a), mitochondria (b), intracellular ATP concentration (c) and reactive oxygen species (ROS) level (d). Blue, red and green boxes represent the values of NR‐S1, X60 and C30 cells. The boxes and error bars show mean value and standard deviation, respectively, of at least three independent experiments. The asterisk shows statistical difference (P < 0.05, Dunnett's test).
