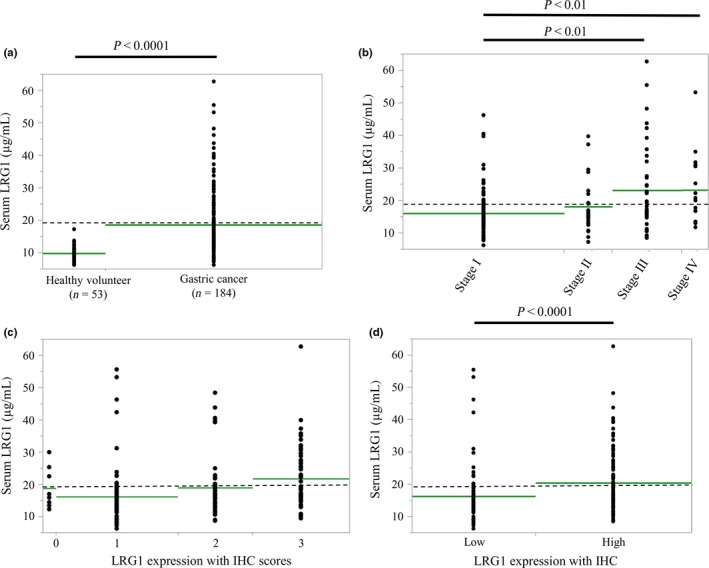
Figure 3.

Detection of serum leucine‐rich α2‐glycoprotein‐1 (LRG1) using ELISA. Serum LRG1 concentrations in 184 patients with gastric cancer and 53 healthy volunteers. Dotted lines show the cut‐off value for LRG1 (19.1 μg/mL). (a) Mean LRG1 concentration for patients with gastric cancer was significantly higher than for healthy volunteers (P < 0.0001). (b) Mean LRG1 concentration increased with the progression of pathological stage. A significant difference was observed between stage I and stage III and between stage I and stage IV disease (P < 0.01). (c) Mean serum LRG1 concentration increased with the progression of the immunohistochemical staining (IHC) scores. (d) IHC results indicate a significant correlation between the serum LRG1 level and LRG1 expression (P < 0.0001).
