Figure 1.

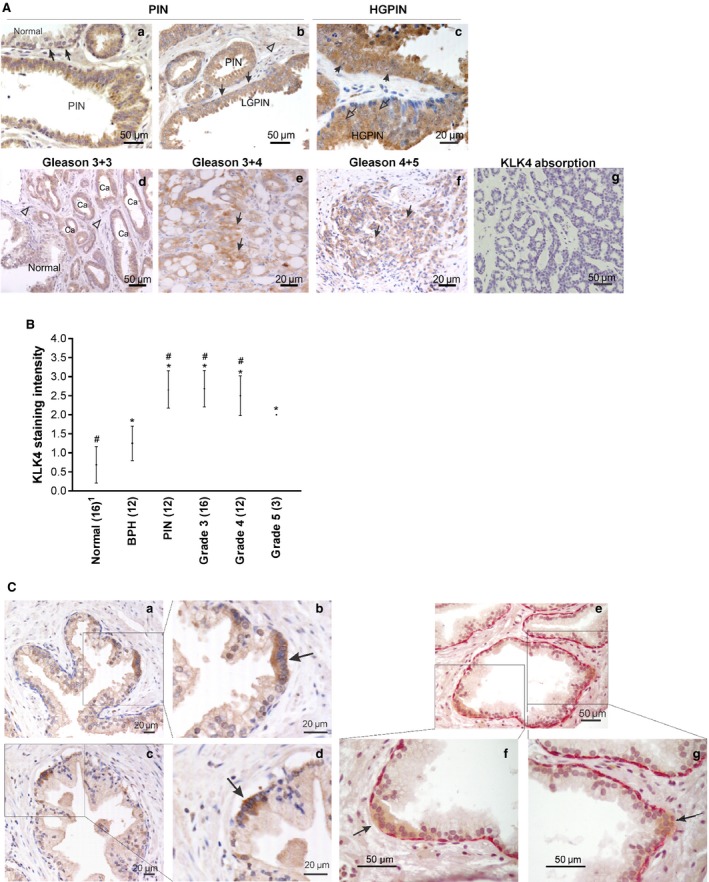
KLK4 expression in the progression of prostate cancer and in foci of atypical suspicious prostate glands. (A) IHC staining of KLK4 in prostate tissues. (a) PIN lesion and adjacent normal glands (Normal, arrows). (b) Low‐grade PIN (LGPIN) with positive staining of basal cells (closed arrows) and no staining in stromal cells (open arrow head). (c) High‐grade PIN (HGPIN) lesions with positive staining in both the nucleus (open arrows) and cytoplasm (arrows) of the secretory cells. (d–f) Strong intensity of KLK4 staining in prostate cancer lesions (Ca or arrows) compared to weak staining of an adjacent normal glands and stroma (Normal and open arrow heads). (g) Anti‐KLK4 antibody absorbance showing no staining, as a negative control. Scale bars are as indicated. (B) Comparison of KLK4 staining intensity in prostate tissues with different Gleason grades. Average staining intensity (●) and SD are shown. Number of region analysed per lesion type is indicated after each lesion name. One‐way ANOVA test, *P < 0.05 compared to normal and # P < 0.05 compared to benign prostatic hyperplasia (BPH). Details can be found in Tables S2 and S3. 1Note that the ‘normal’ prostate sample comprises scores for the single normal prostate tissue specimen and 15 tumour‐adjacent normal prostate tissue regions. (C) (a–d) Low and high magnification of cells in adjacent normal gland showing strong KLK4 staining (box), with the high KLK4 foci appearing to have no basal cells (arrow). (e–g) Low and high magnifications of double staining of high molecular weight cytokeratin 34βE12 and KLK4 in normal prostate gland, showing the KLK4 expressing foci (brown) with disappearing basal cells (arrow) compared to the basal cell layer expressing 34βE12 (pink) in the surrounding area. Scale bars are as indicated. PIN, prostatic intraneoplasia; Ca, cancer.
