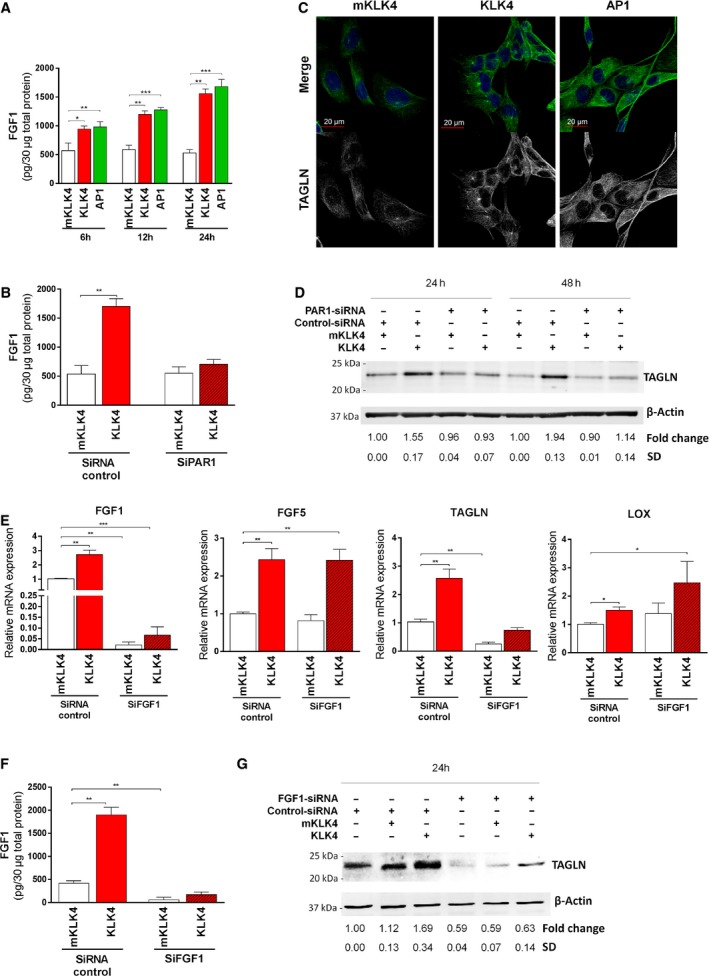
Figure 4.

KLK4 regulates protein expression through PAR1 in prostate‐derived stromal cells. (A–B) FGF1 protein in 30 μg of total cellular proteins was determined using FGF1‐ELISA in (A) WPMY1 cells treated for 6, 12 or 18 h with mKLK4, KLK4 (20 nm) or AP1 (100 μm), or (B) WPMY1 cells transfected with PAR1‐siRNA or control‐siRNA and treated with KLK4 or mKLK4 (20 nm) for 24 h. Results are expressed as mean ± SD from three biological replicates. (C) TAGLN expression was determined by immunofluorescent detection in WPMY1 cells treated for 48 h with mKLK4, KLK4 (20 nm) or AP1 (100 μm). Nuclei were stained using DAPI. Representative images are shown, scale bar: 20 μm. (D) TAGLN expression was determined by western blot in WPMY1 cells transfected with PAR1‐siRNA or control‐siRNA and treated for 24 and 48 h with mKLK4 or KLK4 (20 nm). Densitometry analysis was performed using imagej software on three independent experiments. (E–G) WPMY1 cells transfected with FGF1‐siRNA or control‐siRNA were treated for 24 h with mKLK4 or KLK4 (20 nm). (E). Gene expression was obtained by RTqPCR with expression observed for WPMY1 cells control‐siRNA treated with mKLK4 as reference. Results are presented as mean ± SD of three biological replicates. (F) The amount of FGF1 protein in 30 μg of total cellular proteins was determined using FGF1‐ELISA. Results are expressed as mean ± SD calculated on three biological replicates. (G) TAGLN protein expression was determined by western blot as in D. Densitometry analysis was performed using imagej software on three independent experiments. *P < 0.05, **P < 0.01, ***P < 0.001 compared to reference.
