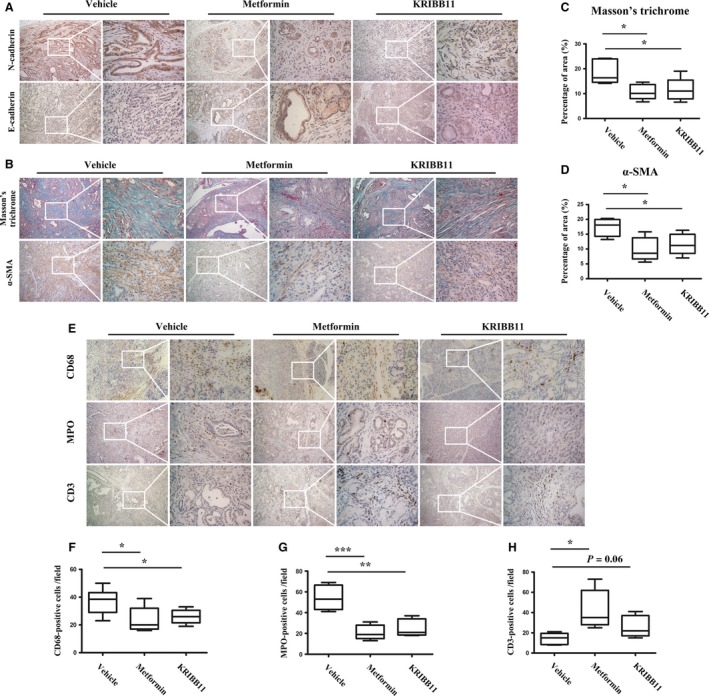
Figure 7.

HSF1 inhibition recapitulated the effect of the metformin‐mediated AMPK activation. (A) IHC staining of N‐cadherin and E‐cadherin in the pancreas from KPC mice treated with vehicle, metformin, or KRIBB11. (B) Masson's trichrome staining and IHC staining of α‐SMA in pancreatic tissues from mice treated with vehicle, metformin, or KRIBB11. (C) Quantification of Masson's trichrome in mice as indicated. (D) Quantification of α‐SMA in mice as indicated. (E) IHC staining of CD68, MPO, and CD3 in KPC mice treated with vehicle, metformin, or KRIBB11. (F–H) Quantification of CD68‐positive cells (F), MPO‐positive cells (G), and CD3‐positive cells (H) in tumors from KPC mice as indicated. Scale bars = 100 μm. *P < 0.05, **P < 0.01, ***P < 0.001.
