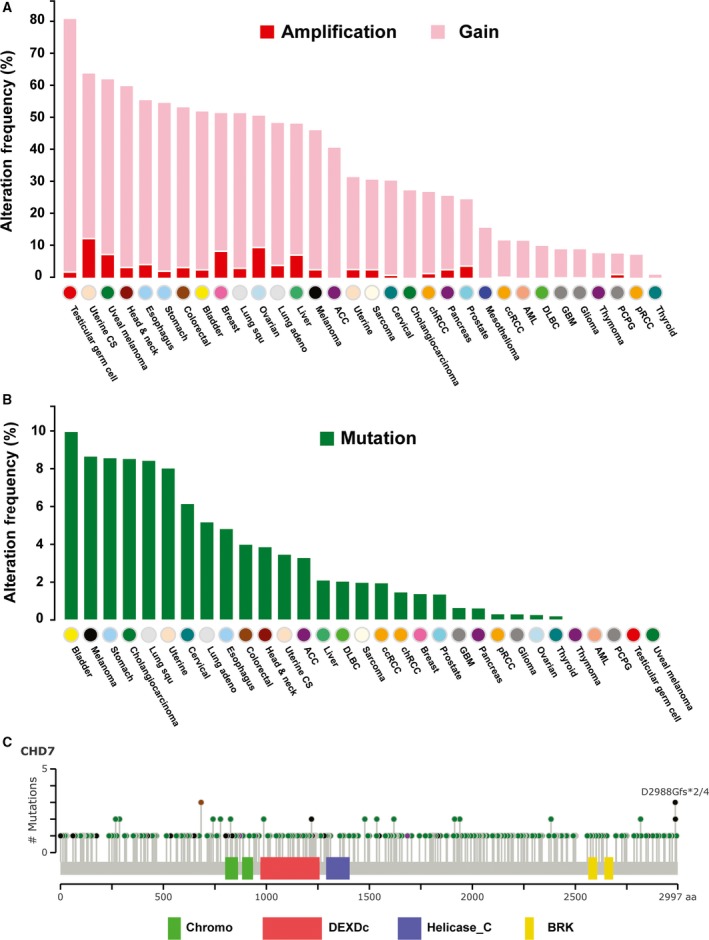
Figure 1.

Genetic alterations of CHD7 in a spectrum of human cancers. (A) Frequencies of CHD7 gain and amplification across 32 TCGA tumor types. (B) Frequencies of CHD7 somatic mutation across 31 TCGA tumor types (excluding mesothelioma, as its mutation data were not available). (C) Mutational spectra of CHD7 gene in human tumors. The images show protein domains and the positions of CHD7 somatic mutations in 31 TCGA tumor types. A green dot indicates a missense mutation, a black dot indicates a truncated mutation, a brown dot indicates an in‐frame insertion or deletion, and a pink dot indicates other mutation. The data were obtained from TCGA database via cBioPortal.
