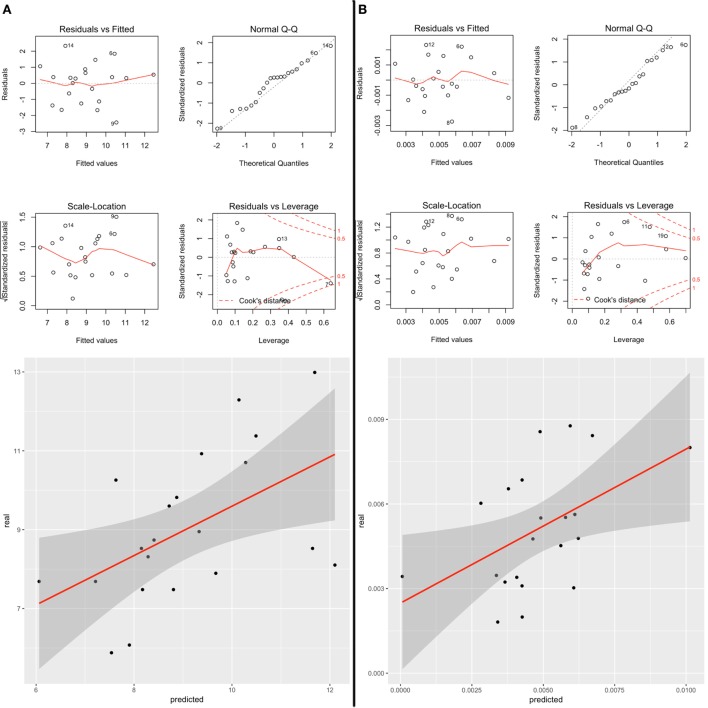
Figure 6.
(A) Correlation between predicted and real measurements of (A) SRT-CLTR z-score and (B) TWT after leave-one-out cross validation. (B) Diagnostic plots shows: (i) residuals function of fitted values (upper left), (ii) the hypothesis of normal distribution of the errors with QQplot (upper right), (iii) that the variance in the Residuals does not change as a function of z-score (bottom left), (iv) and the presence of outliers with Residuals function of Leverage (bottom right).

