-
A
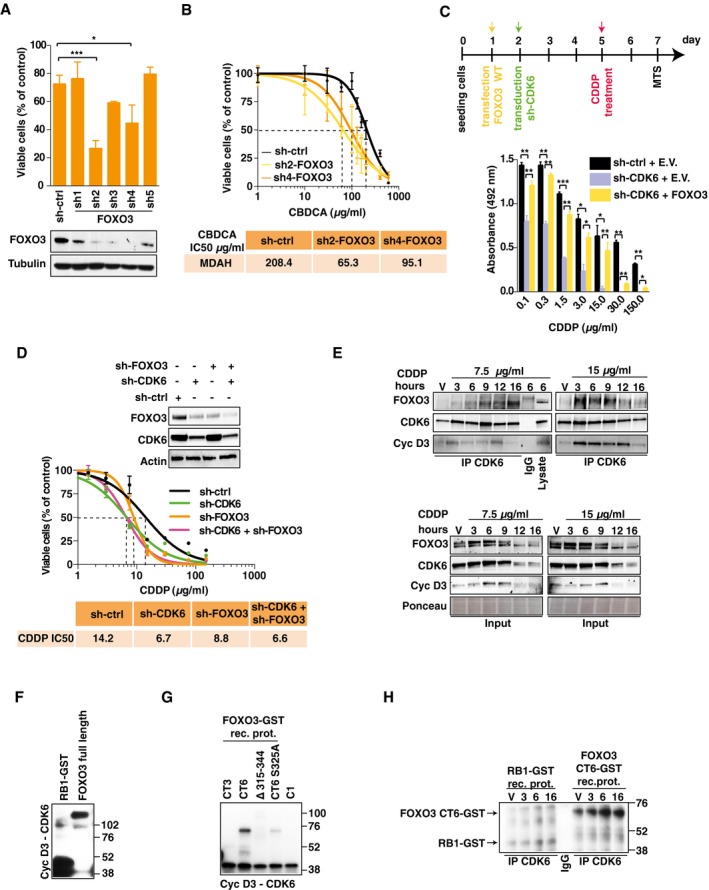
Viability of MDAH cells transduced with FOXO3 shRNAs and treated with CBDCA (140 μg/ml for 16 h). FOXO3 expression is reported. Data represent the mean ± SD of three independent experiments, each performed in triplicate (two‐sided, unpaired t‐test).
-
B
Calculation of CBDCA IC50 in FOXO3‐silenced MDAH cells using two different FOXO3‐shRNAs (three biological replicates). Error bars represent SD.
-
C
Upper panel: Time line of the experiment: day 1: MDAH cells were transfected with empty vector (E.V.) or FOXO3; day 2: transduction with control (ctrl) or CDK6 shRNAs; day 5: CDDP treatment (16 h); day 6: media change; day 7: cell viability assay. Lower panel: graph reports cell viability expressed as absorbance at 492 nm of cells transfected as indicated and treated with increasing concentration of CDDP. Data represent the mean ± SD of three biological replicates (two‐sided, unpaired t‐test).
-
D
Calculation of CDDP IC50 in MDAH cells transduced with control, CDK6, or FOXO3‐specific shRNAs alone or in combination (three biological replicates). Expression of FOXO3 and CDK6 is reported in the upper inset.
-
E
Co‐immunoprecipitation (IP) analysis of endogenous CDK6 in cells treated with vehicle (V) or with 7.5 or 15 μg/ml of CDDP for the indicated times. IPs were evaluated for the presence of CDK6, FOXO3, and cyclin D3, as indicated. In the lower panels, the expression of the same proteins in the corresponding lysates (Input) is reported. IgG indicates a lysate IP with unrelated antibody.
-
F, G
In vitro phosphorylation assay performed using recombinant cyclin D3‐CDK6 complex and GST‐RB1 fragment, FOXO3 full length as substrates (F), or the indicated FOXO3 deletion mutants carrying or not the S325A point mutation as indicated (G). C1: reaction mix plus recombinant kinase.
-
H
In vitro phosphorylation assay performed using CDK6 complex immunoprecipitated from MDAH cells treated with vehicle (V) or with CDDP 15 μg/ml for the indicated hours.
Data information: Tubulin, actin, or Ponceau staining were used as loading control, as indicated in each panel. In each panel, significant differences are evidenced by asterisks (*
.

