-
A
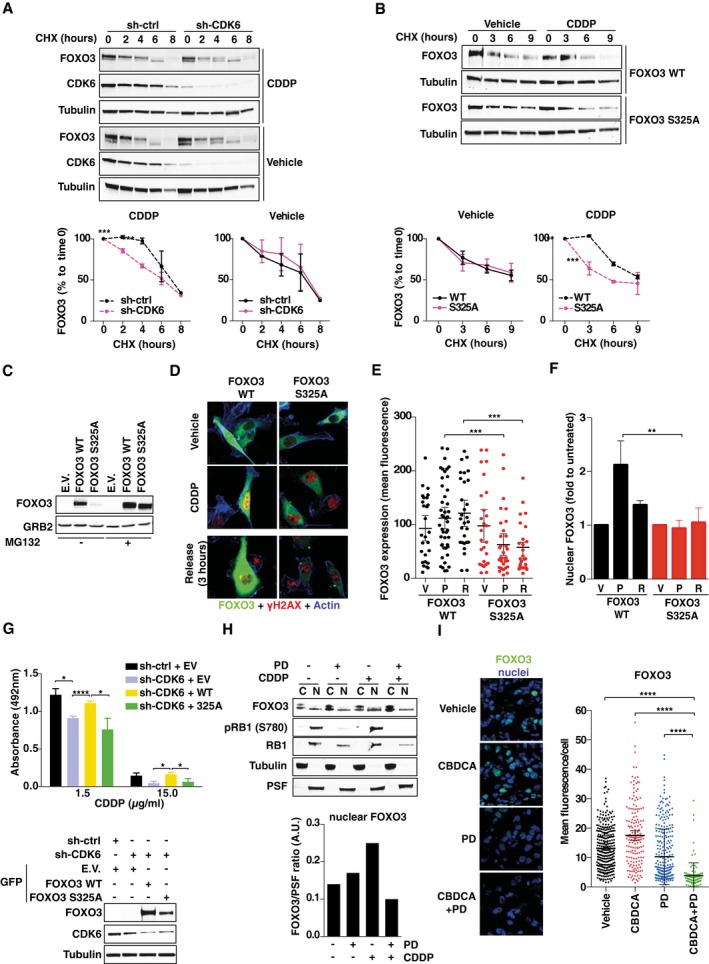
Analysis of FOXO3 stability in control and CDK6‐silenced MDAH cells treated with vehicle or CDDP 15 μg/ml for 3 h and then released in the presence of cycloheximide (CHX) for the indicated times. Densitometric quantification of the FOXO3 expression (mean ± SD) is reported (n = 3) (two‐sided, unpaired t‐test).
-
B
Analysis of FOXO3WT and FOXO3S325A stability in MDAH treated as in (A). Densitometric quantification of the FOXO3 expression (mean ± SD) is reported (n = 3) (two‐sided, unpaired t‐test).
-
C
Analysis of FOXO3WT and FOXO3S325A expression in cells treated as in (A) in the presence or not of MG132.
-
D
Expression and localization of GFP‐FOXO3WT and GFP‐FOXO3S325A (green) and γH2AXS139 (red) in cells treated as indicated in (A). Phalloidin staining is pseudocolored in blue.
-
E, F
Quantification of FOXO3WT and FOXO3S325A expression (E) and localization (F) evaluated as mean fluorescence per cell (E) or folds over untreated cells (F), in cells treated as described in (D). V = vehicle; P = CDDP; R = 3 h release (n = 2 independent experiments in which at least six randomly selected field were analyzed). In (E), bars indicate mean ± 95% CI (Mann–Whitney test). In (F), bars indicate mean ± SD (Mann–Whitney test).
-
G
Viability of control or CDK6‐silenced cells transfected with E.V., FOXO3WT, and FOXO3S325A and then treated with CDDP as indicated. Data represent the mean ± SD (three biological replicates; two‐sided, unpaired t‐test). On the bottom, Western blot analyses show the expression of FOXO3WT and FOXO3S325A EGFP‐tagged proteins and CDK6 in MDAH cells transfected and transduced as indicated.
-
H
Expression of FOXO3 in the nuclear (N) and cytoplasmic (C) fractions of MDAH cells treated or not with CDDP (15 μg/ml, 3 h) and PD (8 μM, 24 h), as indicated. The expression levels of RB1 and pRB1 (S780) are used to monitor PD activity. Graph reports the normalized quantification of nuclear fractions of FOXO3, obtained by densitometric scanning of the blot (FOXO3/PSF ratio).
-
I
Immunofluorescence analysis and quantification of FOXO3 expression in tumors explanted from mice (
n = 3 per group in which at least three randomly selected fields were studied) (see Fig
3A) treated as indicated and evaluated as mean fluorescence per cell. Bars indicate mean ± 95% CI (Mann–Whitney test).
Data information: Tubulin, GRB2, and PSF were used as loading controls. In each panel, significant differences are evidenced by asterisks (*
.

