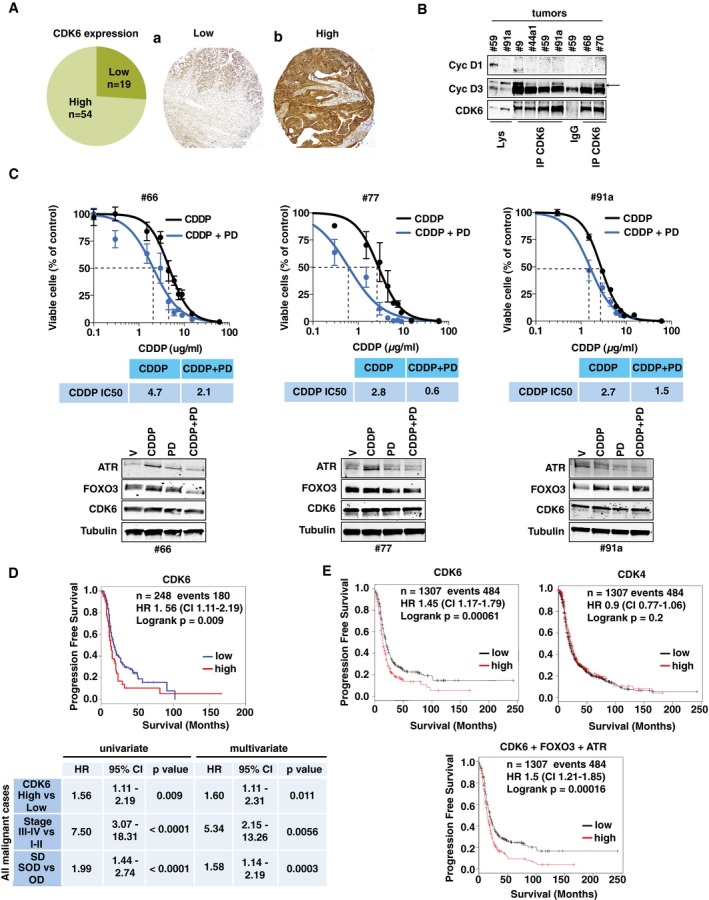
Figure 7. High CDK6 expression predicts poor prognosis in EOC patients.

- Percentage (left pie graph) and typical images of low (A) and high (B) CDK6 expression in a TMA containing 73 EOC samples.
- Co‐IP analysis of CDK6 with cyclin D1 and D3 in the indicated human EOC tumors. IgG = unrelated Ab. Lys = tumor cell lysates. Arrow points to the cyclin D3 band.
- CDDP IC50 of primary cultures derived from the indicated tumors, in the presence or not of PD (three biological replicates ± SD). In the lower panels, the Western blot analyses evaluating the expression of ATR, FOXO3, and CDK6 in the same primary cultures, treated as indicated, is shown.
- Kaplan–Meier survival curve evaluating the progression‐free survival (PFS) in the Tothill dataset, based on the expression of CDK6 (upper panel). The lower table summarizes the significance of CDK6 in predicting PFS in univariate and multivariate analysis (Cox regression) using all malignant cases in the dataset (n = 218; events = 155; log‐rank test was used to calculate significance). HR = hazard ratio; CI = 95% confidence interval.
- Kaplan–Meier survival curve evaluating the significance of CDK6, CDK4, and the CDK6, FOXO3 and ATR combination, in predicting the PFS using the online tool KM Plotter (n = 1,307; events = 484; log‐rank test).
Source data are available online for this figure.
