
Figure EV1. Heterochromatic states are susceptible to the UV carcinogen.
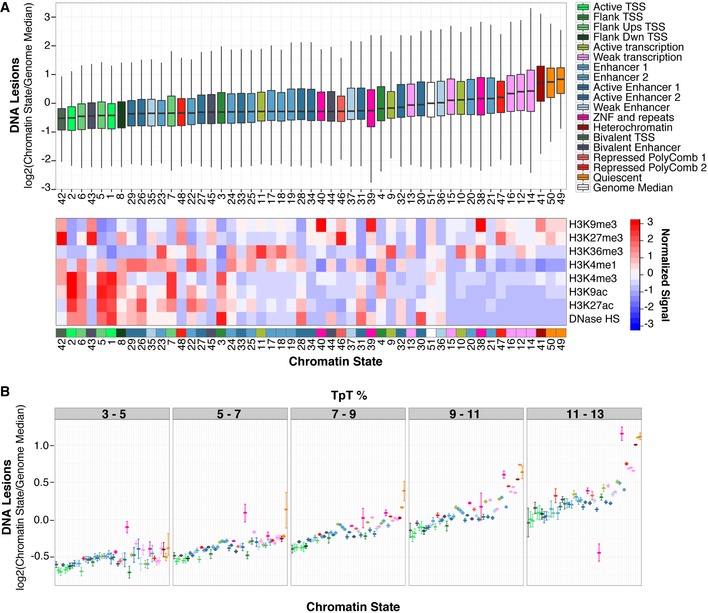
- Same as in Fig 1, except UV lesion abundance was measured within 50 different chromatin states constructed with all IMR90 chromatin marks available in the Roadmap Epigenomics project (Roadmap Epigenomics Consortium et al, 2015). Multiple chromatin states are assigned to individual functional categories. Statistical outliers are omitted.
- UV lesion abundance was calculated as in (A) after binning by TpT content. Error bars denote the 95% confidence interval of the mean based on bootstrapping 1,000 times.