
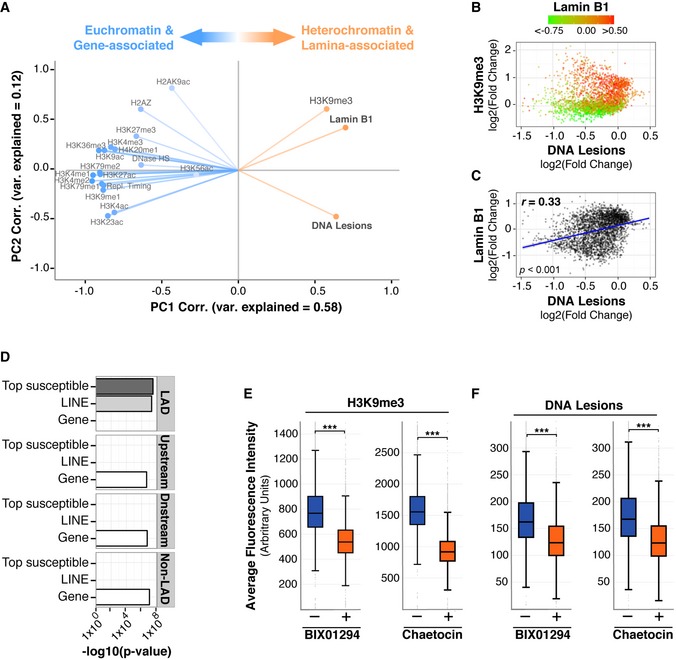
Figure 3. UV susceptibility is elevated in lamin‐associated chromatin.
-
APrincipal component analysis. Correlation of abundance for indicated features to principal component (PC) 1 and PC2 values across the entire genome. Degree of variance (var) explained is indicated within each PC.
- B
-
CScatter plot comparing lamin B1 association (Guelen et al, 2008) and DNA lesion abundance (IP/input) at 1 Mb resolution.
-
DEnrichment significance (−log 10 (P‐value hypergeometric test)) for the overlap in bps of the indicated genomic features and LADs, 100‐kb upstream, 100‐kb downstream, and a non‐LAD random control. “Top susceptible” are genomic regions with the top 5% of UV lesion abundance using 1 Mb windows.
-
E, FIMR90 primary cells were treated with Chaetocin or BIX01294 for 72 h. Cells were irradiated with 100 J/m2 UVC for <10 s and immediately fixed and stained using antibodies against H3K9me3 (E) or CPD lesions (F). Box plots of average fluorescence intensity determined by FACS analysis are shown. Middle quartiles are represented by boxes, top and bottom quartiles are represented by whiskers. Minimum of 20,000 cells were used for each sample. Chi‐square test is ***P < 0.0001 for each plot.