
Figure EV4. UV susceptibility is correlated with heterochromatin and lamin B1 and is not sequence‐dependent.
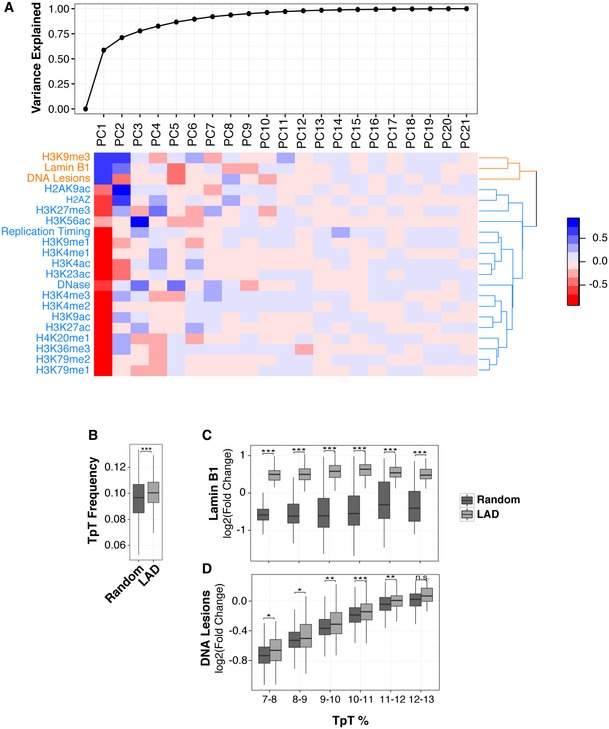
- Principal component analysis was performed with the indicated features at a 1‐Mb scale (refer to Materials and Methods for more details). Top, cumulative variance explained by all principal components (PCs). Bottom, the correlation heatmap is shown. Rows in heatmap were reordered based on a hierarchical clustering using Euclidean distance.
- The TpT content of LADs and randomly selected regions of equal size.
- Lamin B1 abundance distribution in LADs and a random control after binning based on TpT dinucleotide content.
- DNA lesion signal distribution (IP/input) in same groups as in (B). Random control was generated by arbitrarily sampling non‐LAD regions of the genome of the same number, size, and chromosomal distribution of LADs.