
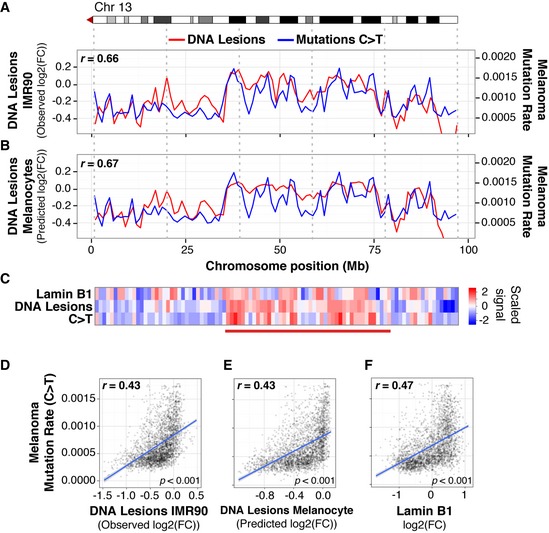
Figure 6. UV lesion distribution in primary cells mirrors mutation rates in malignant melanoma.
-
A, BUV lesion abundance (red) and C>T mutation frequency (blue) in malignant melanoma along the right arm of chromosome 13 at a 1‐Mb scale. UV lesions are quantified by measuring fold change (FC) of IP/input. Observed UV lesion abundance in IMR90 cells (A) and predicted UV lesion abundance in melanocytes, obtained by a Random Forest Regression using melanocyte chromatin marks (described in Fig 2D) and DNase I hypersensitivity as predictor variables (B).
-
CHeatmap showing scaled signal (refer to Materials and Methods) of UV lesion, lamin B1, and C>T mutations along right arm of chromosome 13 at a 1‐Mb scale.
-
D–FGenome‐wide mutation frequency in melanoma compared to UV lesion abundance (D); predicted UV lesion abundance in melanocytes (E); and lamin B1 association (F). Y‐axes are truncated at the 99th percentile.