
Figure 7. Genes frequently mutated in melanoma have increased UV susceptibility.
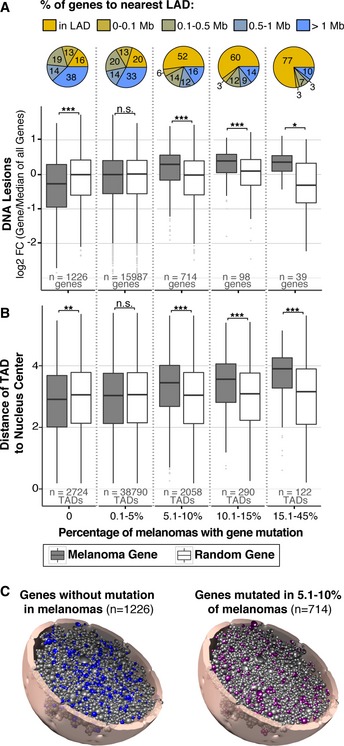
- Abundance of UV‐induced DNA lesions on all genes (Melanoma Gene, gray boxes) binned by the frequency of mutation in melanoma samples, available from the cancer browser in the COSMIC database (Forbes et al, 2015). n = number of genes per bin. Abundance is measured as fold change (FC) of binned genes/median of all genes in genome. Controls (Random Genes, white boxes) for each bin contain a random selection of the same number of genes as their corresponding bin. Percentage of genes with designated lamin‐associated domain (LAD) proximity is shown within each bin.
- For genes in (A), distance from center of nucleus was predicted using the Chrom3D model described in Fig 5B. TAD number exceeds gene number because each gene is assigned to two or more TADs due to copy number and genes that span multiple TADs.
- Tomographic view of data shown in (B) showing the 3D location of genes that are not mutated (0%) in melanoma (left model) and genes mutated in 5.1–10% of melanomas (right model). The 5.1–10% model was chosen among others because the number of genes provides a comparative graphical representation to the 0% model.