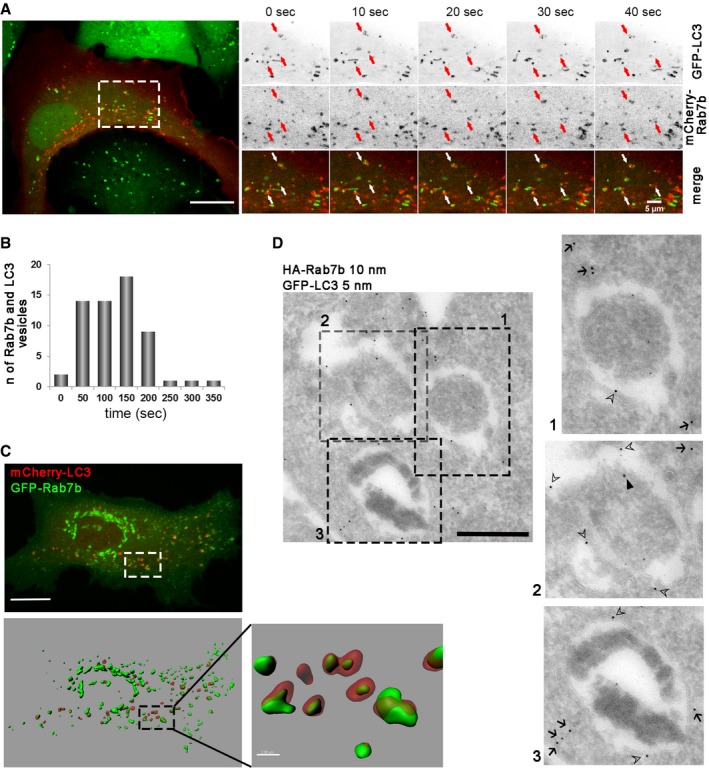
Figure 2. Rab7b dynamically interacts with autophagic membranes.

- Live‐cell imaging of U2OS GFP‐LC3 cells transiently transfected with mCherry‐Rab7b. The arrows indicate Rab7b‐ and LC3‐positive vesicles moving together. Scale bars: 15 μm and 5 μm.
- Frequency histogram representing the quantification of how long Rab7b‐ and LC3‐positive vesicles move together before separating. Total number of objects counted (n) is shown for 60 different cells from three independent experiments.
- Live‐cell imaging of U2OS cells transiently transfected with GFP‐Rab7b and mCherry‐LC3. 3D volume rendering (top) and the relative Imaris isosurface 3D rendering (bottom) are shown. Scale bar: 15 μm. Magnification of the boxed area is shown in the inset on the right (scale bar: 2 μm).
- Double immunogold labeling of U2OS cells stably transfected with GFP‐LC3 and transiently transfected with HA‐Rab7b. HA‐Rab7b (10 nm gold) localizes to outer (open arrowheads) and inner (filled arrowheads) membranes of autophagosomes, identified by LC3 labeling (5 nm gold) and characteristic ultrastructure (cytoplasmic mass surrounded with electron lucent area representing double membrane), or to small vesicles close to autophagosomes (arrows). Scale bar: 500 nm.
