-
A–C
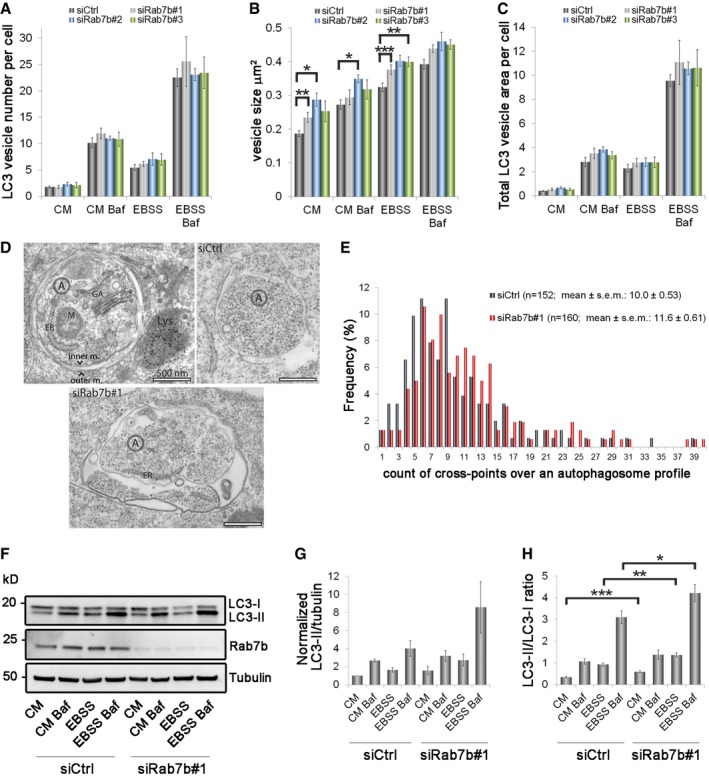
U2OS cells transfected with control siRNA (siCtrl) or three different siRNAs against Rab7b (#1, #2, or #3) were incubated for 2 h in either CM, CM with BafA1, EBSS, or EBSS with BafA1, before fixation and staining with anti‐LC3 and Hoechst. The graphs represent the quantification of the number (A), size (B), and total area (C) of endogenous LC3‐positive vesicles per cell. Data represent the mean ± s.e.m. of at least four independent experiments (n > 60 cells).
-
D
Ultrastructural analysis of autophagosomes by transmission electron microscopy. Autophagosomes (A) were identified as membrane‐bound compartments containing morphologically intact cytoplasm, usually represented by ribosomes and endoplasmic reticulum (ER), and sometimes containing other organelles, such as mitochondria (M) or Golgi apparatus (GA). They did not contain colloidal BSA‐gold 5 nm (outlined with a dashed line), which was pulse‐chased to late endosomes and lysosomes (Lys). Examples of autophagosomes in control and samples knocked down for Rab7b are shown. Scale bar: 500 nm.
-
E
Semi‐quantitative analysis of the autophagosome size by TEM shown as frequency distributions. Total number of autophagosomes counted (n) is shown for images collected from five different sections, representing different cell populations, for each of the indicated samples. The Student's two‐sample t‐test P‐value was 0.0504.
-
F
Cell lysates from cells transfected with control siRNA or siRNA against Rab7b were subjected to Western blot analysis with the indicated antibodies.
-
G, H
Quantification of LC3‐II levels normalized against the amount of tubulin and plotted relative to the intensities obtained in cells transfected with control siRNA in CM (G) and of LC3‐II/LC3‐I ratio (H). Data represent the mean ± s.e.m. of at least four independent experiments.
Data information: Statistical significance was evaluated in (A–C, G, and H) using paired Student's
‐test. *
< 0.001.

