
Figure 4. The Tip60 HAT complex regulates FOXO1 expression in mammalian cells.
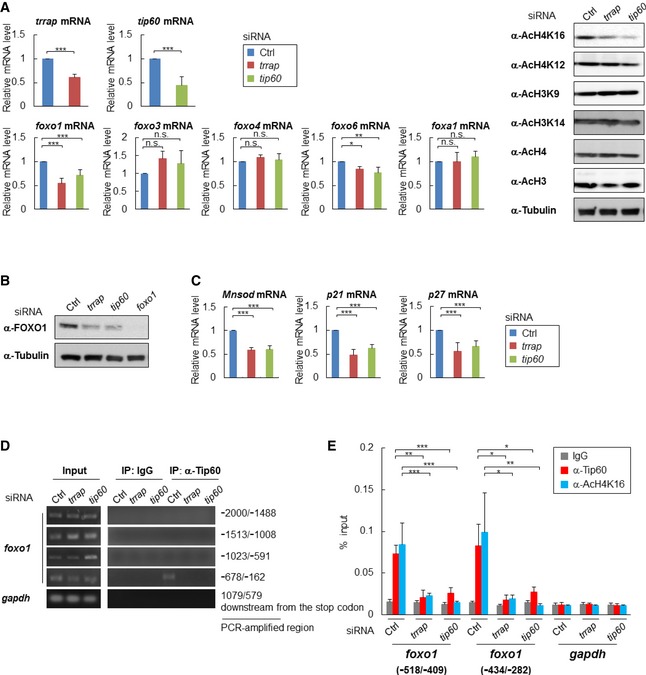
- HeLa cells were transfected with the indicated siRNA, and each sample was subjected to qRT–PCR (left) or immunoblot analysis (right). Error bars represent the SD derived from three independent experiments. *P < 0.05, **P < 0.01, ***P < 0.001, n.s., not significant; one‐way ANOVA followed by Tukey's test. The value of the control siRNA‐transfected cells was set to 1.
- Total cell lysates extracted from the indicated siRNA‐transfected HeLa cells were subjected to immunoblot analysis using anti‐FOXO1 antibodies. Representative images of three independent experiments are shown.
- Total RNA was extracted from the indicated siRNA‐transfected HeLa cells, and the mRNA expression levels of Mnsod, p21, and p27 were determined by qRT–PCR. Error bars represent the SD derived from three independent experiments. ***P < 0.001, one‐way ANOVA followed by Tukey's test. The value of the control siRNA‐transfected cells was set to 1.
- Tip60 binding was examined by ChIP–PCR using crosslinked DNA–protein complexes isolated from the indicated siRNA‐transfected HeLa cells with anti‐Tip60 and control IgG antibody. PCR amplification was done with specific primers for the foxo1 and gapdh promoter regions. Representative images of two independent experiments are shown. Genomic DNA in the input samples was used as a positive control.
- Tip60 binding and histone H4K16 acetylation were examined by ChIP–qPCR using crosslinked DNA–protein complexes isolated from the indicated siRNA‐transfected HeLa cells with anti‐Tip60, anti‐AcH4K16, and control IgG antibody. The bars represent the percentage of total input DNA for each ChIP sample, and error bars represent the SD derived from three independent experiments. *P < 0.05, **P < 0.01, ***P < 0.001, one‐way ANOVA followed by Tukey's test.
Source data are available online for this figure.