
Figure EV4. Overexpression of FOXO1.
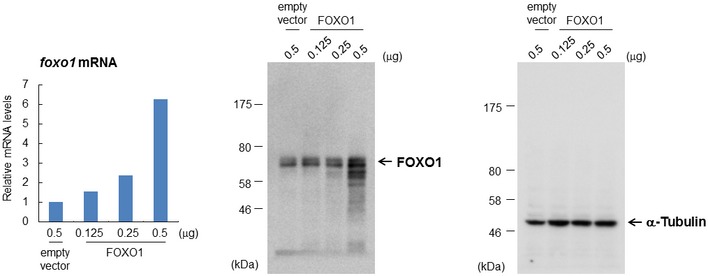
HeLa cells were transfected with the indicated plasmid, and each sample was subjected to qRT–PCR (left) or immunoblot analysis (middle and right). The value of the control vector‐transfected cells was set to 1. Data from one experiment are shown.