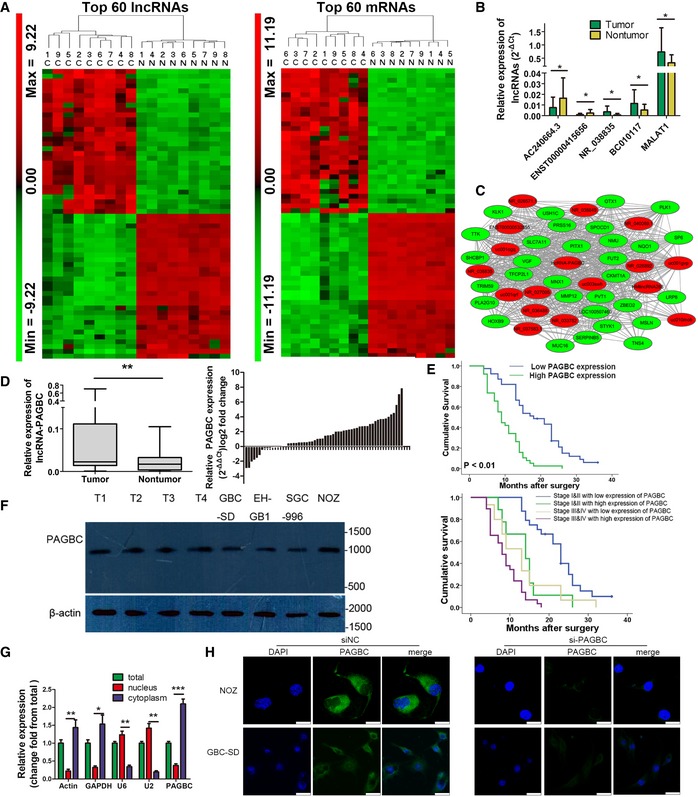
Heatmaps of the top 60 lncRNAs (left) and protein‐coding RNAs (right) that were differentially expressed between GBC samples (c, cancer tissues) and non‐tumour samples (n, non‐tumour samples). The colour scale shown on the left illustrates the relative expression level of RNA; red represents high expression and green represents low expression.
The differential expression of four randomly selected lncRNAs and MALAT1 in 26 paired GBC and non‐tumour samples was determined via qRT–PCR. lncRNA expression is expressed as the lncRNA/GAPDH expression ratio (i.e. 2−ΔCt). Data are mean ± SD (n = 26).
lncRNA‐PAGBC subnetwork in the GBC coexpression network. This subnetwork consists of 17 lncRNAs (red) and 30 protein‐coding genes (green) with fold change ≥ 10.0 and a P‐value ≤ 0.05.
lncRNA‐PAGBC expression in human GBC tissues and paired non‐tumour tissues was analysed via qRT–PCR. The results are shown by box plots (left) and bar charts (right). In the box plot, horizontal lines in the box plots represent the median, the boxes represent the interquartile range, and whiskers represent the 2.5th and 97.5th percentiles (n = 60).
Upper panel: The survival rates of 77 HCC patients who underwent surgery were compared between the high‐ and low‐lncRNA‐PAGBC expression groups. Lower panel: Kaplan–Meier survival curves of gallbladder cancer patients with different expression levels of PAGBC stratified by the TNM stage of the tumour. P‐value was obtained by log‐rank test. Stage I and II gallbladder cancers with low expression level of PAGBC versus high expression level of PAGBC, P < 0.01; Stage III and IV gallbladder cancers with low expression level of PAGBC versus high expression level of PAGBC, P < 0.05; Stage I and II gallbladder cancers with high expression level of PAGBC versus Stage III and IV gallbladder cancers with low expression level of PAGBC, P > 0.05.
Northern blot analysis of lncRNA‐PAGBC in GBC tissues and cells shows the length of the lncRNA‐PAGBC fragment. Molecular weight markers are indicated on the right. β‐actin was used as an internal control.
qRT–PCR analysis of lncRNA‐PAGBC expression in NOZ cells. The total, nuclear and cytoplasmic RNA fractions were extracted. β‐actin, GAPDH, U2 and U6 were used as endogenous controls. Data are mean ± SD (n = 3).
Localization of lncRNA‐PAGBC by RNA‐FISH in GBC‐SD and NOZ cells transfected with negative control siRNA(siNC) or PAGBC siRNA. Nuclei are stained blue (DAPI), and lncRNA‐PAGBC is stained green. Scale bars represent 25 μm.
‐test).

