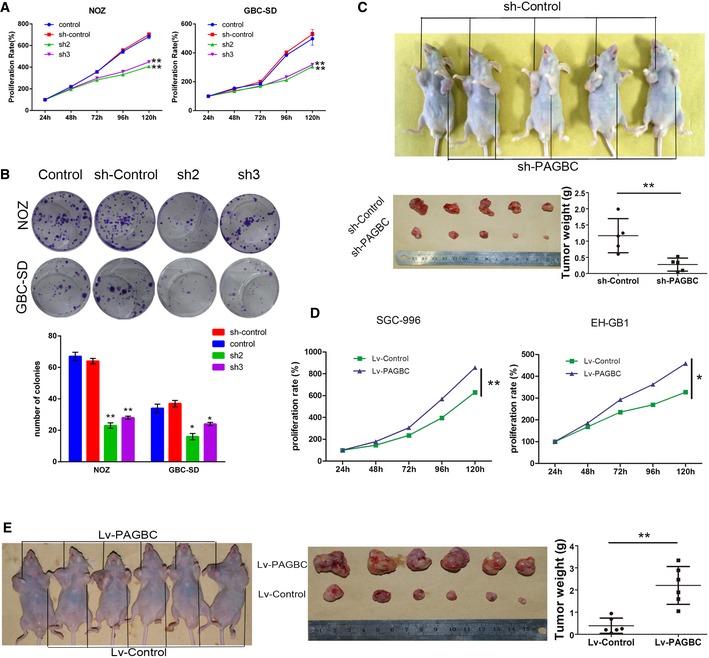
Figure 2. lncRNA‐PAGBC regulates proliferation in GBC cells.

-
A, BThe proliferation of NOZ and GBC‐SD cells stably transfected with a lentivirus encoding a shRNA against lncRNA‐PAGBC (sh2, sh3) was measured using CCK‐8 assays (A) and colony formation assays (B). Typical photographs of colony formation assays are shown in (B), and the graph below shows the number of colonies by the indicated cells. Data are mean ± SD of triplicate samples.
-
CA subcutaneous implant model was established using NOZ cells. The graphs below show the tumours developed and a statistical plot of the average tumour weights in the subcutaneous implant model. Data are mean ± SD (n = 5).
-
DThe proliferation of SGC‐996 and EH‐GB1 cells stably transfected with a lentivirus encoding lncRNA‐PAGBC was measured using CCK‐8 assays. Data are mean ± SD of triplicate samples.
-
EA subcutaneous implant model was established using EH‐GB1 cells. The graph in the middle shows the tumours developed, and the graph on the right shows a statistical plot of the average tumour weights in this model. Data are mean ± SD (n = 6).
