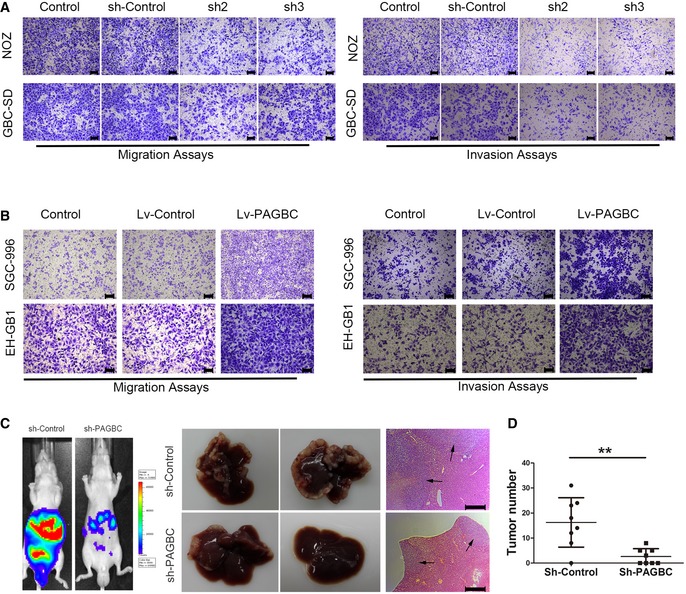
Figure 3. lncRNA‐PAGBC promotes the metastasis of GBC cells.

- Transwell migration (left) and invasion (right) assays of NOZ and GBC‐SD cells transfected with a lentivirus encoding a shRNA against lncRNA‐PAGBC. Scale bars represent 100 μm.
- Transwell migration (left) and invasion (right) assays of SGC‐996 and EH‐GB1 cells transfected with a lentivirus encoding lncRNA‐PAGBC. Scale bars represent 100 μm.
- Intrasplenic injection model was established using NOZ cells. Representative images of luciferase signals in the mice at 42 days after the intrasplenic injection of 2 × 10⁶ cells of the indicated NOZ cell clones (left). Middle panel: Representative livers from mice from the left panel. Right panel: Haematoxylin and eosin‐stained images of liver tissues isolated from the mice shown on the left. Scale bars represent 500 μm. Black arrows indicate the metastatic tumour.
- A statistical plot of the average number of liver metastases in the intrasplenic injection model. The data are shown as the means ± SD, n = 8. **P < 0.01 (Student's t‐test)
