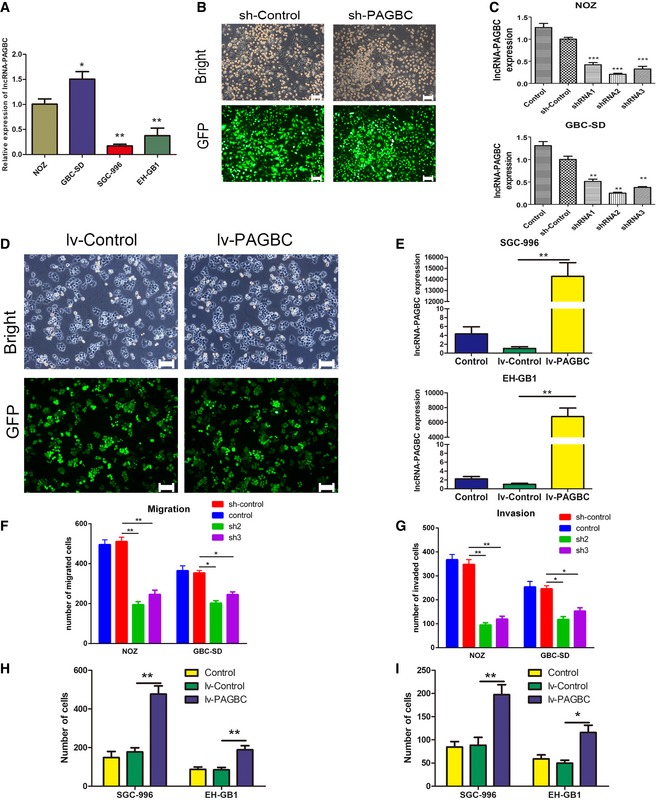
Figure EV3. lncRNA‐PAGBC promotes the proliferation and metastasis of GBC cells.

-
AThe relative PAGBC expression in different cell lines was determined using quantitative real‐time PCR. The data were compared with NOZ cells. Data are mean ± SD (n = 3).
-
BThe transfection efficiency was determined 3 days after incubation with the lentivirus. The GFP‐labelled transfected cells were observed under a light microscope and a fluorescence microscope. Light micrograph (upper panel); fluorescence micrograph (lower panel). Scale bars represent 100 μm.
-
CRelative PAGBC expression was determined using quantitative real‐time PCR. GAPDH was used as an internal control. The data were compared with the sh‐Control. The data are shown as the means ± SD of triplicate samples.
-
DThe transfection efficiency was determined 3 days after incubation with the lentivirus. The GFP‐labelled transfected cells were observed under a light microscope and a fluorescence microscope. Light micrograph (upper panel); fluorescence micrograph (lower panel). Scale bars represent 100 μm.
-
ERelative PAGBC expression was determined using quantitative real‐time PCR. GAPDH was employed as an internal control. The data are shown as the means ± SD of triplicate samples.
-
F, GA statistical plot of the average number of migrated (F) or invaded (G) NOZ and GBC‐SD cells shown in Fig 3A. The data are shown as the means ± SD of triplicate samples.
-
H, IA statistical plot of the average number of migrated (H) or invaded (I) EH‐GB1 and SGC‐996 cells shown in Fig 3B. The data are shown as the means ± SD of triplicate samples.
