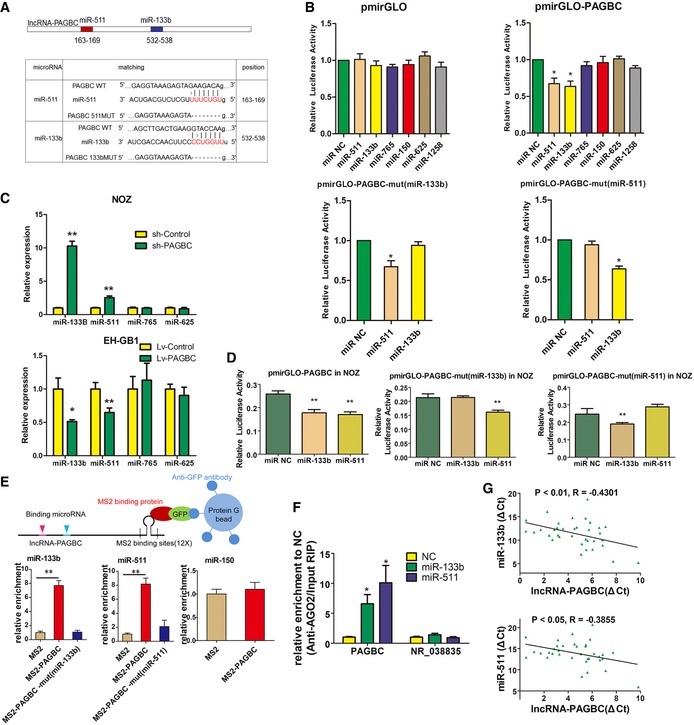
Figure 4. lncRNA‐PAGBC competitively binds and absorbs microRNAs as a competing endogenous RNA .

- Upper panel shows schematic representation of the predicted binding sites for miR‐133b and miR‐511 in lncRNA‐PAGBC. Lower panel presents the predicted miR‐133b and miR‐511 binding sites in the lncRNA‐PAGBC transcript. The red nucleotides are the seed sequences of the microRNAs. The target site mutations are underlined.
- Luciferase activity in 293T cells cotransfected with miR‐133b and miR‐511 and luciferase reporters that were empty (upper left panel) or contained lncRNA‐PAGBC (upper right panel) or the indicated mutant transcript (lower panel). Data are presented as the relative ratio of firefly luciferase activity to Renilla luciferase activity. The data are shown as the means ± SD of triplicate samples.
- MicroRNA expression levels in GBC cells after transfection with lentiviruses containing the indicated shRNAs (upper panel) or the indicated transcripts (lower panel) via qRT–PCR. The data are shown as the means ± SD of triplicate samples.
- Luciferase activity in NOZ cells cotransfected with miR‐133b and miR‐511 and luciferase reporters that contained lncRNA‐PAGBC (left) or the indicated mutant transcript (middle and right). The data are shown as the means ± SD of triplicate samples.
- MS2‐RIP followed by microRNA qRT–PCR to detect miR‐133b (lower left panel) and miR‐511 (lower middle panel) that endogenously associated with lncRNA‐PAGBC. miR‐150 was used as a negative control (lower right panel). A schematic outline of the MS2‐RIP strategy used to identify microRNAs endogenously associated with lncRNA‐PAGBC is shown (upper panel). The data are shown as the means ± SD of triplicate samples.
- Anti‐AGO2 RIP was performed in NOZ cells transiently overexpressing miR‐133b and miR‐511, followed by qRT‐PCR to detect lncRNA‐PAGBC or lncRNA‐NR_038835 associated with AGO2. The data are shown as the means ± SD of triplicate samples.
- The correlation between lncRNA‐PAGBC transcript level and miR‐133b (upper panel) or miR‐511 (lower panel) transcript level was measured in 35 GBC tissues. The ΔC t values were subjected to Pearson correlation analysis.
