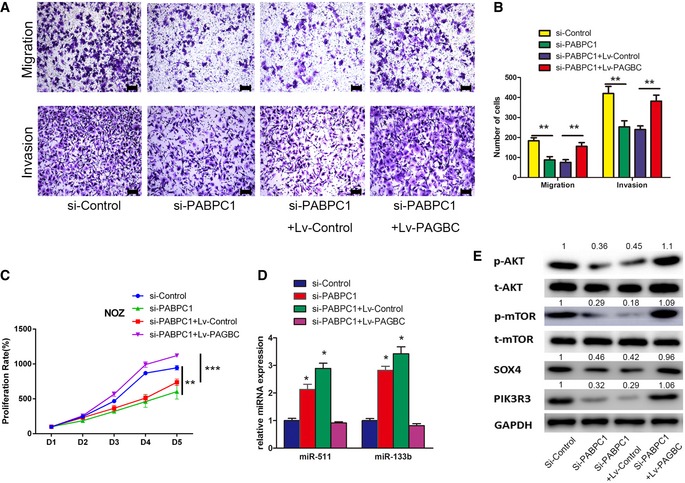
Figure EV4. The role of PABPC1 on the function of lncRNA‐PAGBC .

- Transwell migration and invasion assays of NOZ transfected with siRNA against the indicated transcripts and transfected with the lentivirus encoding the indicated transcripts. Scale bars represent 100 μm.
- A statistical plot of the average number of migrated or invaded NOZ cells shown in (A). The data are shown as the means ± SD of triplicate samples.
- The proliferation of NOZ cells transfected with siRNA against the indicated transcripts and transfected with the lentivirus encoding the indicated transcripts was measured using CCK‐8 assays. Data are mean ± SD (n = 3).
- qRT–PCR was performed to detect the expression of miR‐133b and miR‐511 in NOZ cells transfected with siRNA against the indicated transcripts and transfected with the lentivirus encoding the indicated transcripts. Data are mean ± SD (n = 3).
- Western blotting analysis of p‐AKT, t‐AKT, p‐mTOR, t‐mTOR, SOX4 and PIK3R3 in NOZ cells transfected with siRNA against the indicated transcripts and transfected with the lentivirus encoding the indicated transcripts.
