
Figure 5. lncRNA‐PAGBC upregulates SOX4 and PIK3R3 levels.
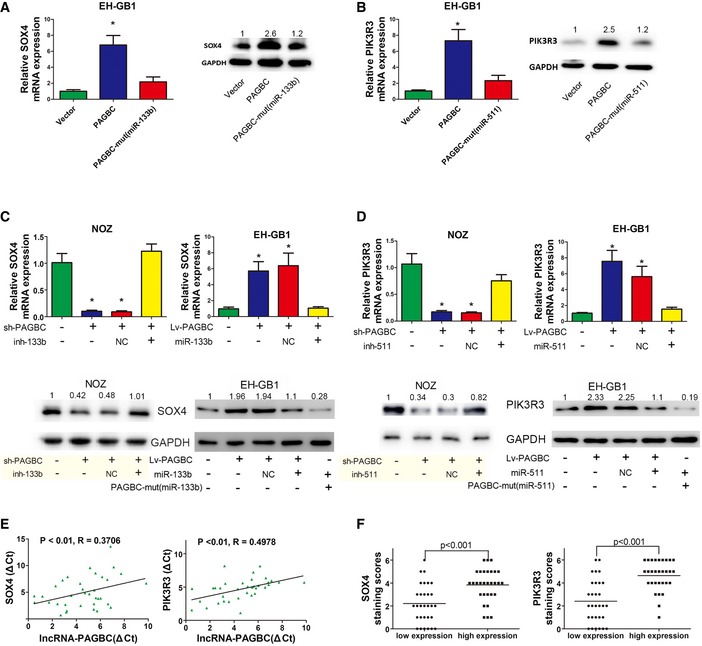
- SOX4 mRNA (left) and protein (right) levels after the indicated plasmids were transfected into EH‐GB1 cells. Data are mean ± SD (n = 3).
- PIK3R3 mRNA (left) and protein (right) levels after the indicated plasmids were transfected into EH‐GB1 cells. Data are mean ± SD (n = 3).
- SOX4 mRNA (upper panel) and protein (lower panel) levels in stable NOZ and EH‐GB1 cell clones after transfection of the indicated miR‐133b inhibitors or mimics. Data are mean ± SD (n = 3).
- PIK3R3 mRNA (upper) and protein (lower) levels in stable NOZ and EH‐GB1 cell clones after transfection of the indicated miR‐511 inhibitors or mimics. Data are mean ± SD (n = 3).
- The correlation between lncRNA‐PAGBC transcript level and SOX4 (left) or PIK3R3 (right) mRNA transcript level was measured in 35 GBC tissues. The ΔC t values were subjected to Pearson correlation analysis.
- Scatterplots of the average staining scores for SOX4 (left) and PIK3R3 (right) expression in patients with low or high expression of lncRNA‐PAGBC.