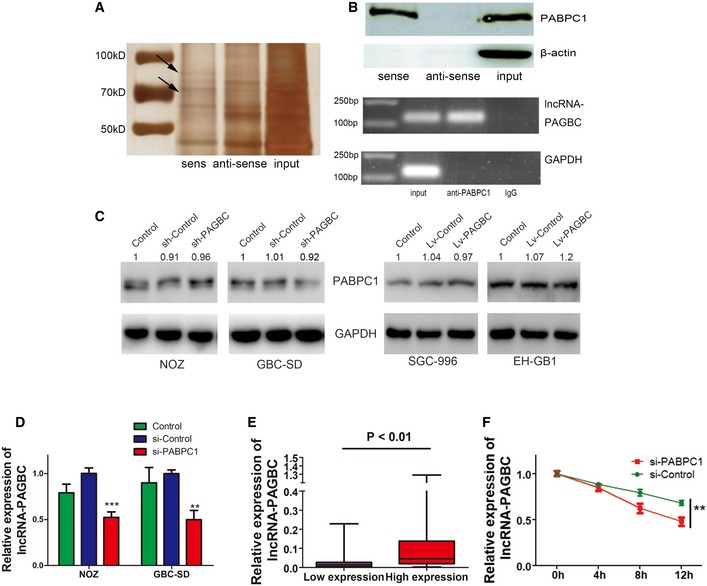
Figure 7. PABPC1 interacts with lncRNA‐PAGBC and increases the stability of lncRNA‐PAGBC .

- RNA pull‐down assays were performed in NOZ cells. The two bands highlighted by the arrow were submitted for mass spectrometry analysis.
- Upper panel: Western blot analysis following RNA pull‐down assays performed using NOZ cellular extracts. An antibody against the β‐actin protein was used as the negative control. Lowe panel: RIP experiments were performed on extracts from NOZ cells using an antibody against PABPC1.
- PABPC1 protein expression levels in GBC cells were determined by Western blot analysis.
- qRT–PCR was performed to measure the expression of lncRNA‐PAGBC in GBC cells. The data are shown as the means ± SD.
- After dividing the 77 GBC tissue samples into two groups according to PABPC1 expression, the expression levels of lncRNA‐PAGBC were compared. The data are shown as the means ± SD.
- NOZ cells were transfected with a siRNA against PABPC1 for 48 h and then treated with actinomycin D (10 μmol/l) to block RNA synthesis. lncRNA‐PAGBC levels were measured via qRT–PCR and normalized to the level of GAPDH. All values at time 0 h were normalized to 1.
