
FIGURE 3.
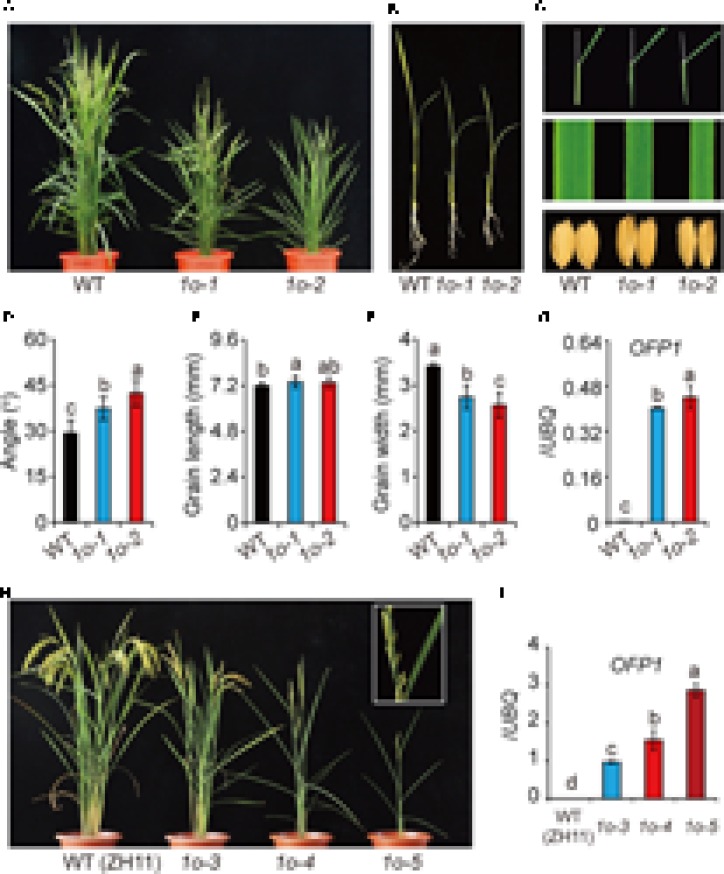
Phenotype analysis of OFP1 overexpression plants. (A) Gross morphology of two representing OFP1 overexpression plants in DJ background, designated as 1o-1 and 1o-2 for short, at the reproductive stage. (B) Seedling morphology of 1o-1 and 1o-2 compared with WT. (C) Detailed comparison of leaf angle, leaf width, and grain morphology. Statistical data of the leaf angle (D), grain length (E), and grain width (F) of the plants. n = 12 in (D), n = 20 in (E,F), bar = SD. Different letters above the columns indicate statistically significant differences between groups (Fisher’s LSD, p < 0.05). (G) Relative OFP1 expression in the plants tested by qRT-PCR. UBQ gene was used as internal reference. n = 3, bar = SD. Different letters above the columns indicate statistically significant differences between groups (Fisher’s LSD, p < 0.05). (H) Phenotypes of three representing OFP1 overexpression plants in ZH11 background, designated as 1o-3, 1o-4, and 1o-5 for short. Enlarged picture showed the development of sterile seeds and roll leaves in the severe line. (I) Relative OFP1 expression in the plants tested by qRT-PCR. UBQ gene was used as internal reference. n = 3, bar = SD. Different letters above the columns indicate statistically significant differences between groups (Fisher’s LSD, p < 0.05).