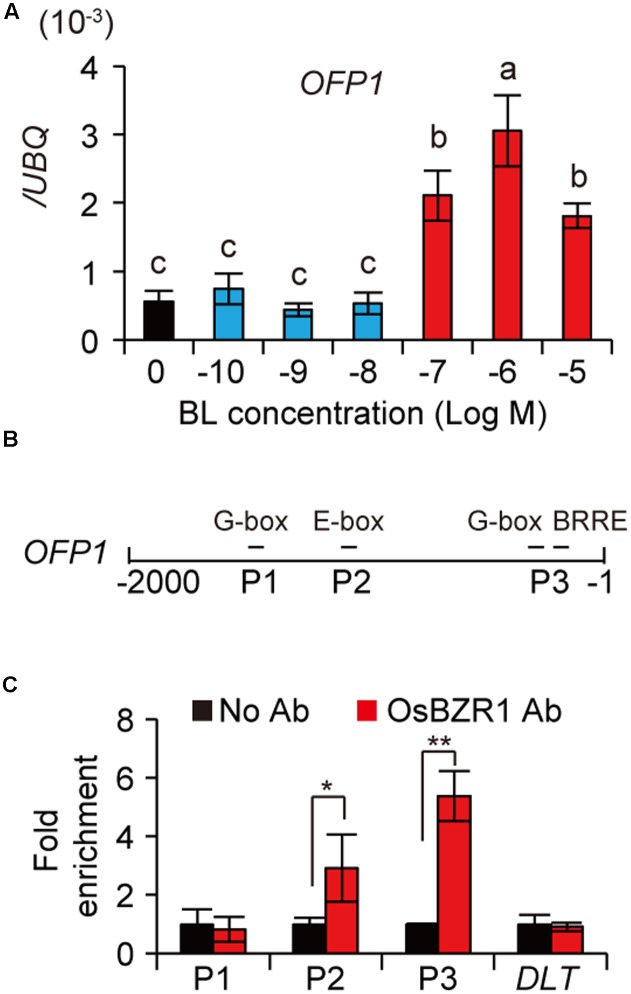
FIGURE 5.
BR induces OFP1 transcription by OsBZR1 binding. (A) Expression analysis of OFP1 under the treatment of BL with different concentrations. UBQ gene was used as internal reference. n = 4, bar = SD. Different letters above the columns indicate statistically significant differences between groups (Fisher’s LSD, p < 0.05). (B) Schematic show of OFP1 promoter. Putative BZR1 targeted cis-elements and the segments (P1–P3) for ChIP-qPCR analysis were indicated. (C) ChIP-qPCR analysis of OsBZR1 binding on OFP1 promoter using OsBZR1 antibody. A segment reside in DLT coding region was used as control. n = 3, bar = SD, ∗p < 0.05, ∗∗p < 0.01 in Student’s t-test.

