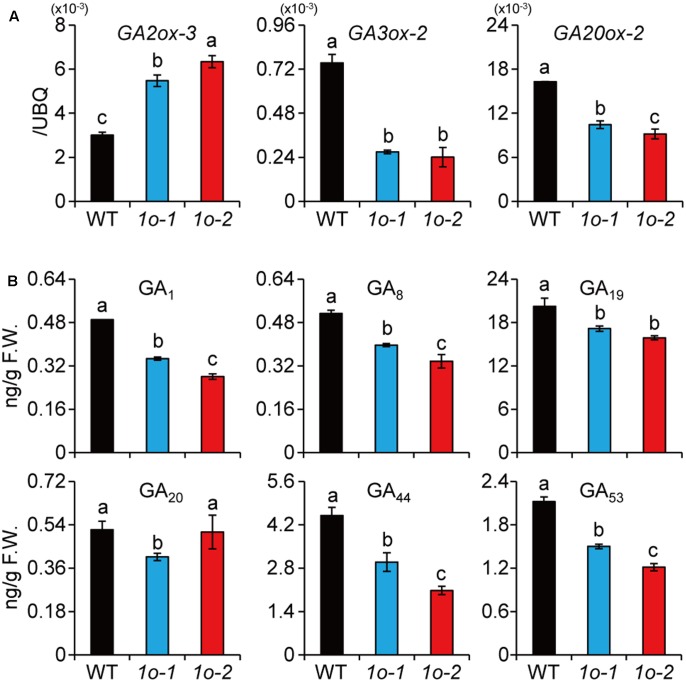
FIGURE 6.
OFP1 overexpression plants have decreased GA synthesis. (A) Relative expression of the GA metabolism genes in 1o-1 and 1o-2. Expression in WT was set as 1.0. UBQ gene was used as internal reference. n = 3, bar = SD. Different letters above the columns indicate statistically significant differences between groups (Fisher’s LSD, p < 0.05). (B) Quantification of GA levels in 1o-1 and 1o-2. F.W., fresh weight. n = 3, bar = SD. Different letters above the columns indicate statistically significant differences between groups (Fisher’s LSD, p < 0.05).

