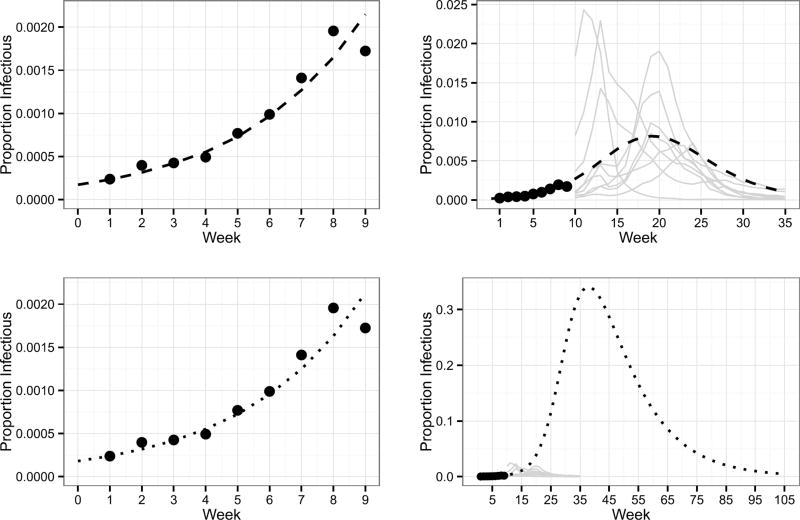
Fig. 3.
The mean process defined by equation (4.1b) for two sets of parameters are displayed. The parameters corresponding to the dashed trajectory (top) are , , , β = 2.22, γ = 1.7017, and κ = 20,000. The parameters corresponding to the dotted trajectory (bottom) are , , , β = 0.3912, γ = 0.077, and κ = 20,000. Points are 2010 ILI+ observations for weeks one through nine. Grey lines are the ILI+ trajectories for years 2002–2007 and 2011–2013 for weeks 10 through 35.

