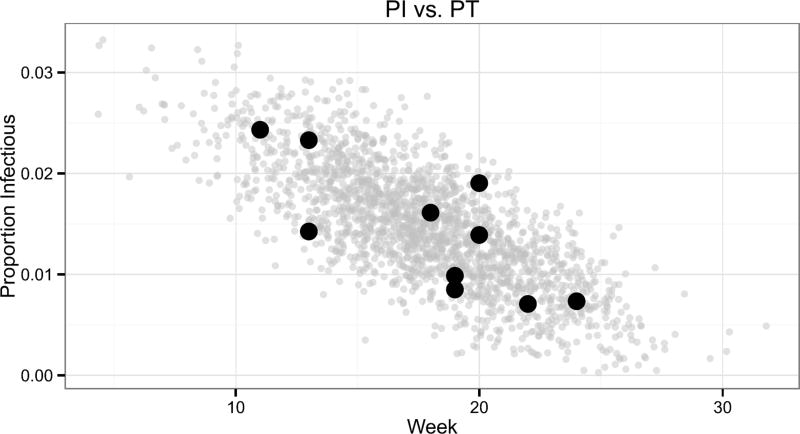
Fig. 4.
The peak intensity (PI) on the y-axis vs. the timing of peak intensity (PT) on the x-axis for years 2002–2007 and 2010–2013 (black points). 10,000 samples were drawn from the truncated normal distribution of equation (6.10) with and plotted in grey.

