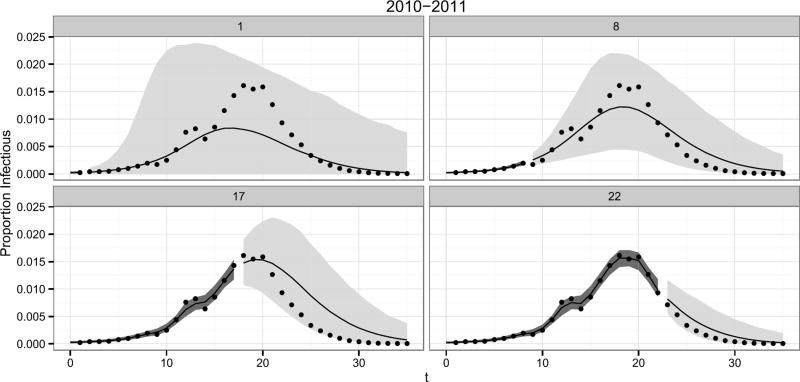
Fig. 6.
95% posterior predictive intervals for [y(t′+1):T|y1:t′] (light grey bands) and 95% credible intervals for (dark grey bands). Posterior medians (black lines) and ILI+ observations (points) are also displayed for the 2010 nationwide, influenza seasons. The number at the top of each panel is t′. All plots are based on 5000 simulations.

