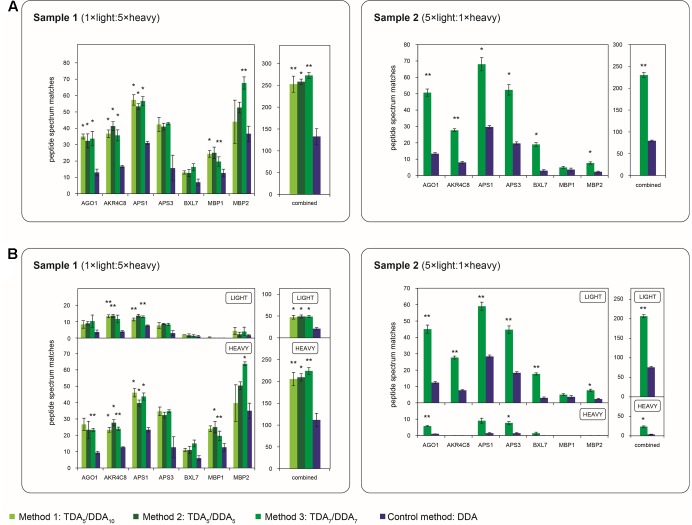
FIGURE 3.
Average numbers of peptide spectrum matches obtained for the miRNA target proteins of Table 1 in TDA/DDA and DDA control method experiments. (A) Average peptide spectrum matches for each individual targeted protein, and for all targeted proteins combined, per technical replicate in each batch of LC-MS/MS experiments conducted on sample 1 (left) and sample 2 (right). (B) The same data shown separately for light (above) and heavy (below) peptide spectrum matches. Statistically significant differences between TDA/DDA and DDA control method experiments, as determined using 2-tailed t-tests, are labeled ∗p < 0.05 or ∗∗p < 0.01.

