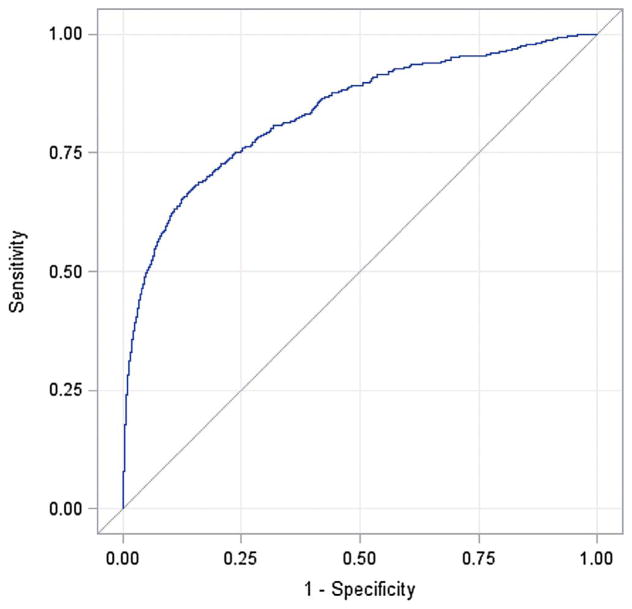
Fig. 2.
Receiver Operating Characteristic Curve for the prediction of Drug Abuse from our Aggregate Risk Factor index developed from a multivariate logistic regression analysis on a first random half of our sample and then tested on our second half. The X-axis assesses “1-specificity” while the Y-Axis reflects sensitivity. The area under the curve is estimated ( ± 95% CIs) at 0.836 (0.817–0.855).

