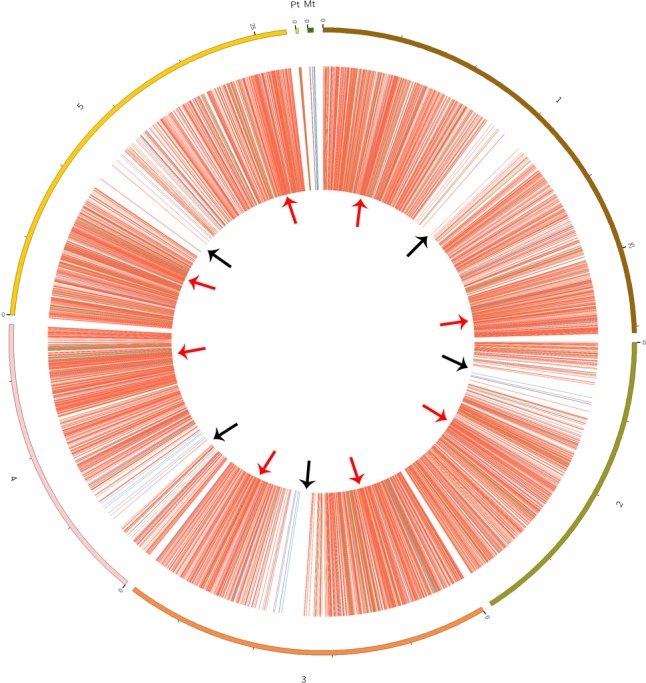
FIGURE 1.

Circos plots showing the identified circRNA distribution in the Arabidopsis thaliana genome. Red, green, and blue lines represent exonic, intronic, and intergenic circRNAs, respectively. Red arrows show the genome region with a high density of circRNAs; black arrows show the regions with rare circRNAs.
