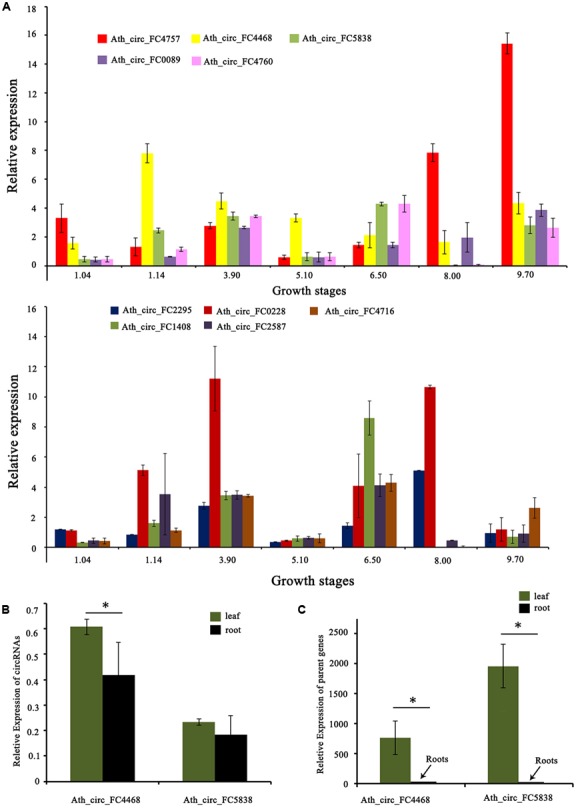
FIGURE 5.

Expression of circRNAs and their parent genes at different developmental stages or in various organs. (A) qRT-PCR shows the different expression levels of 10 circRNAs at seven growth stages. (B) qRT-PCR shows the different expression levels of Ath_circ_FC4468 and Ath_circ_FC5838 in leaf and root, respectively. (C) The different expression levels of the corresponding parent genes of Ath_circ_FC4468 and Ath_circ_FC5838 in leaf and root, respectively. The y-axes show relative expression levels analyzed by qRT-PCR. Columns and error bars indicate means and standard deviations of relative expression levels (n = 3), respectively. Significant difference (p < 0.05) between leaf and root was also evaluated. ∗ represents p < 0.05.
