
Fig. 6.
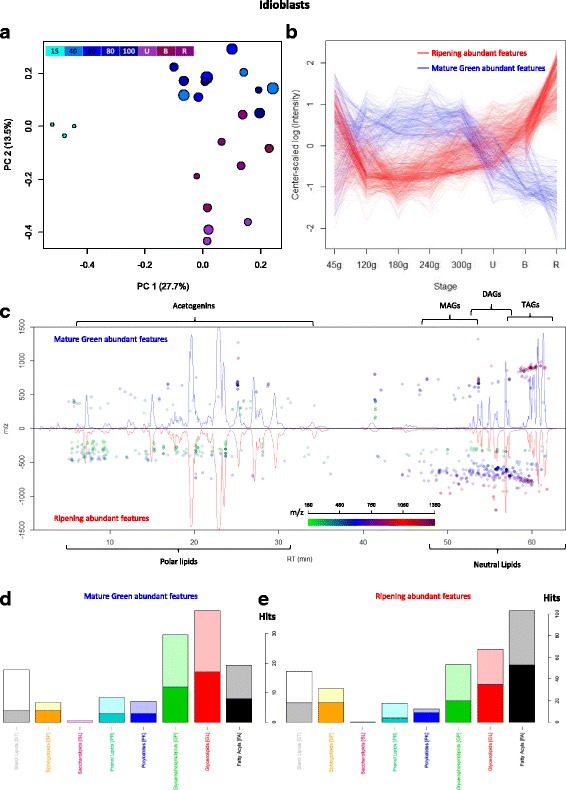
Lipidome of idioblasts isolated from avocado mesocarp during fruit maturation and ripening. (a) PCA analysis of features detected in all idioblasts samples, fruit growing and ripening stage is indicated by color and mesocarp DW is depicted by circle size. (b) Mean values (n = 3) as a function of fruit growth and ripening stage of two divergent groups of selected features (see Additional file 1: Figure S7) from PC1, blue lines represent features that are characteristic of idioblasts from growing fruit and red lines of ripening fruit. (c) Cloud plot with chromatograms of idioblasts from mature green mesocarp (top) and ripe mesocarp (bottom), dots are placed above the feature elution time and their color and position represents the feature’s m/z. (d) Classification of Features characteristic of idioblasts from growing and (e) ripening fruit by Lipid MAPS® Classification [45]