Fig. 1.

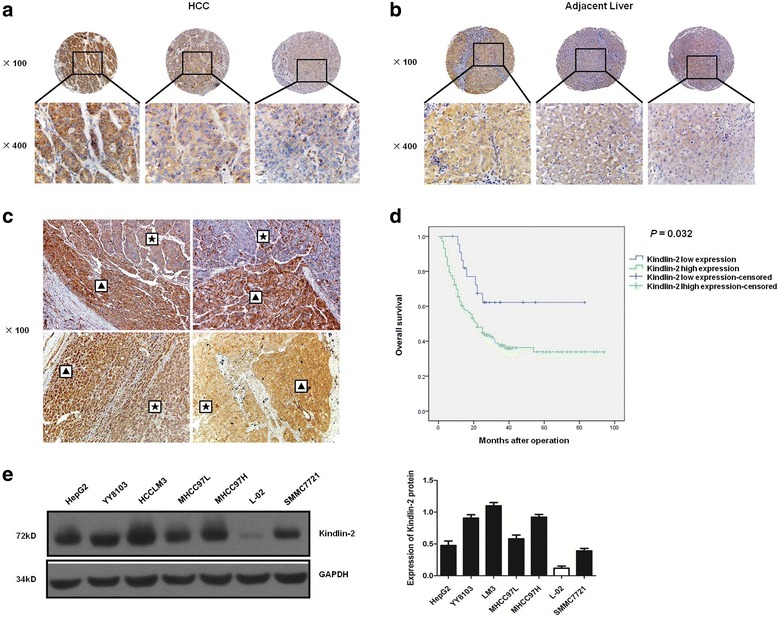
Kindlin-2 expression is upregulated in HCC tissues and cell lines. a, b Immunohistochemical analysis of Kindlin-2 expression in a TMA of 127 pairs of HCC and adjacent liver tissues. Staining intensity is scored as: 3, tawny (left), 2, medium yellow (middle) and 1, pale yellow (right). c Immunohistochemical analysis of Kindlin-2 expression in another 50 pairs of HCC and adjacent liver tissues. Kindlin-2 expression is higher in tumor margins than central areas in some samples. ▲: tumor margin, ★: central area. d Kaplan–Meier analysis of overall survival for HCC patients in cohort 1 with high or low Kindlin-2 expression. HCC patients with high Kindlin-2 expression have shorter overall survival than those with low Kindlin-2 expression. Cases with IHC staining total scores, which is obtained through intensity score multiplying by proportion score, of 4–12 were defined as Kindlin-2 high expression and those with total scores of 0–3 as Kindlin-2 low expression. e Western blot analysis of Kindlin-2 expression in six human HCC cell lines and one normal liver cell line
