. 2017 Sep 18;2017:9780213. doi: 10.1155/2017/9780213
Copyright © 2017 Daniel J. Zaccarini and Kamal K. Khurana.
This is an open access article distributed under the Creative Commons Attribution License, which permits unrestricted use, distribution, and reproduction in any medium, provided the original work is properly cited.
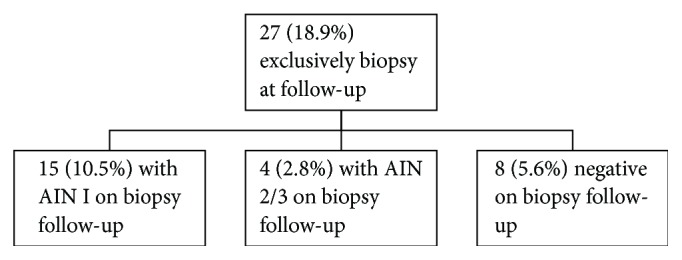
Figure 3.

Chart showing exclusively biopsy follow-up results.
