Figure 4.

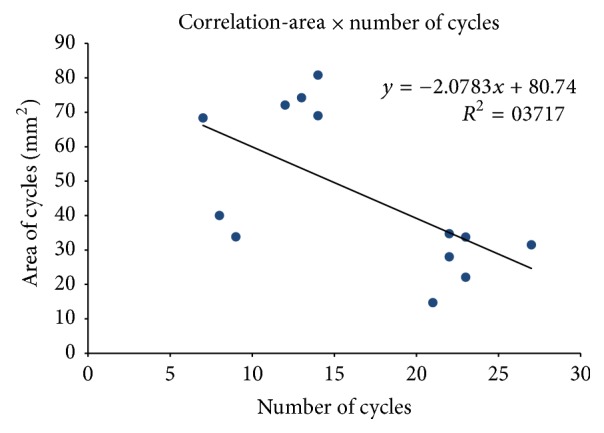
Scatter plot of correlation between the number and mean area of masticatory cycles. A negative correlation between the evaluated factors was noted, whose formula is shown in the chart.

Scatter plot of correlation between the number and mean area of masticatory cycles. A negative correlation between the evaluated factors was noted, whose formula is shown in the chart.