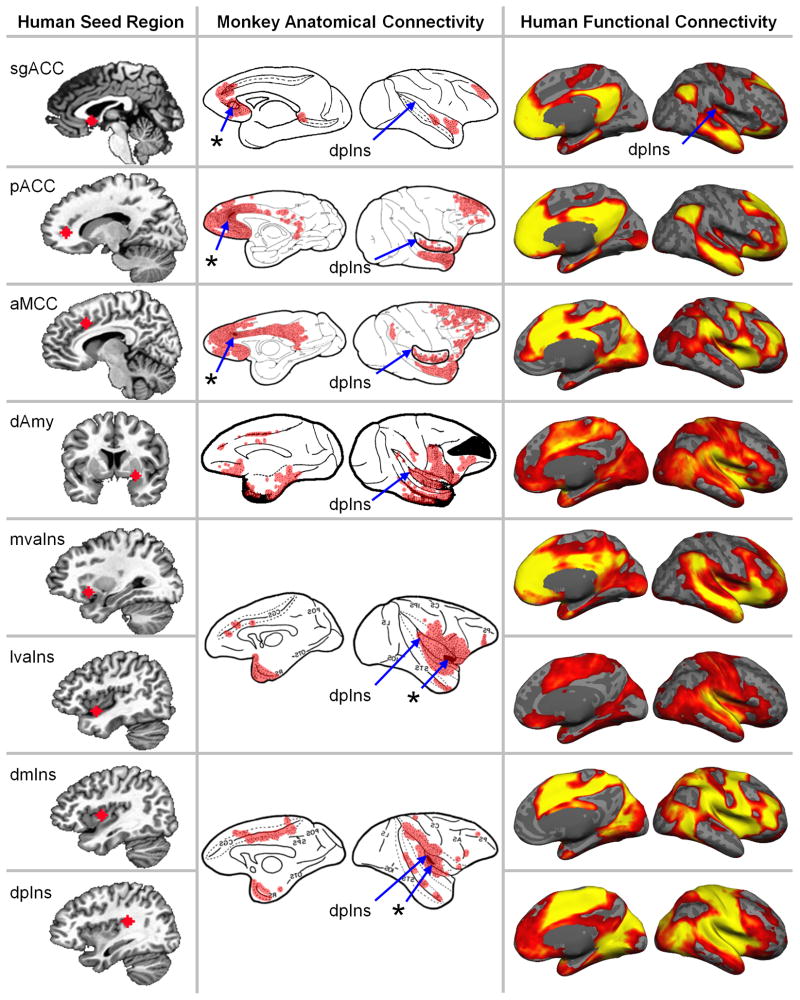
Fig. 2.
Eight regions (“seeds”) used to estimate the unified allostasis/interoceptive system connecting the cortical and amygdalar visceromotor regions and primary interoceptive regions. The left column shows the “seed” region for each discovery map on a human brain template. The middle column summarizes the anatomical connectivity derived from anterograde and/or retrograde tracers injected in macaque brains at a location homologous to the human seed (asterisks with blue arrows). The right column shows the human intrinsic connectivity discovery maps depicting all voxels whose time course is correlated with the seed’s (ranging from p < 10−5 in red to p < 10−40 in yellow, uncorrected, N = 280). To avoid Type I and Type II errors, which are enhanced with the use of stringent statistical thresholds196, we opted to separate signal from random noise using replication, according to the mathematics of classical measurement theory148. These results replicated in a second sample, N = 270 participants, indicating that they are reliable and cannot be attributed to random error (Supplementary Figure 1). Functional connectivity to the entire amygdala and other subcortical regions are shown in Fig. 4. Tract tracing figures were adapted with permission as follows: subgenual anterior cingulate cortex (sgACC) via retrograde tracers in Fig 1 of Vogt & Pandya (1987)169, pregenual ACC (pACC) via retrograde tracers in Fig 5 of Morecraft, et al. (2012)157, anterior midcingulate cortex (aMCC) via retrograde tracers in Fig 7 of Morecraft, et al. (2012)157, dorsal amygdala (dAmy) via retrograde tracers in Fig 3 of Aggleton, et al. (1980)165, medial ventral anterior insula (mvaIns) and lateral ventral anterior insula (lvaIns) via anterograde tracers in Fig 1 of Mesulam & Mufson (1982)158, dorsal mid insula (dmIns) and dorsal posterior insula (dpIns) via anterograde tracers in Fig 3 of Mesulam & Mufson (1982)158. The monkey anatomical connectivity figures were colored red to visualize results and some were mirrored to match the orientation of the human brain maps. The figures from Morecraft, et al. (2012)157 were adapted to show the insula in its lateral view.

