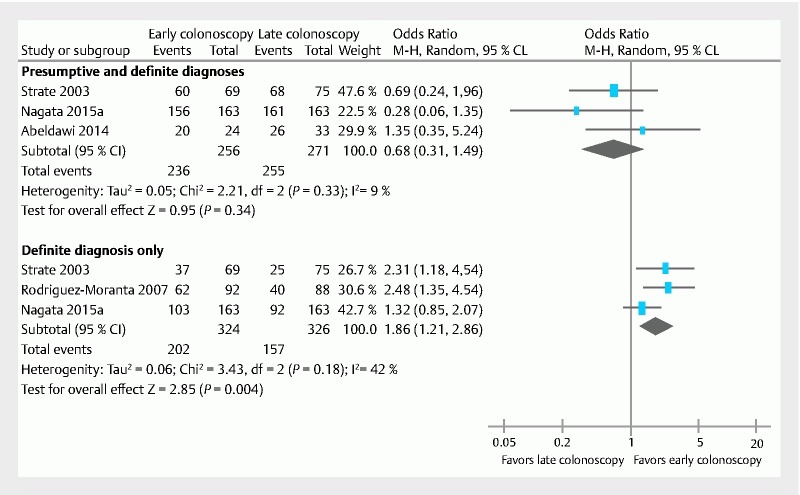
Fig. 2.

Forest plot of comparison of nonrandomized studies of intervention. Upper: Presumptive plus definite diagnoses. Lower: Definite diagnoses only. Definitive diagnoses were defined by the presence of stigmata of recent hemorrhage or active bleeding, plus the diagnosis of an underlying cause. CI, confidence interval; M-H, Mantel-Haenszel.
