Figure 3.

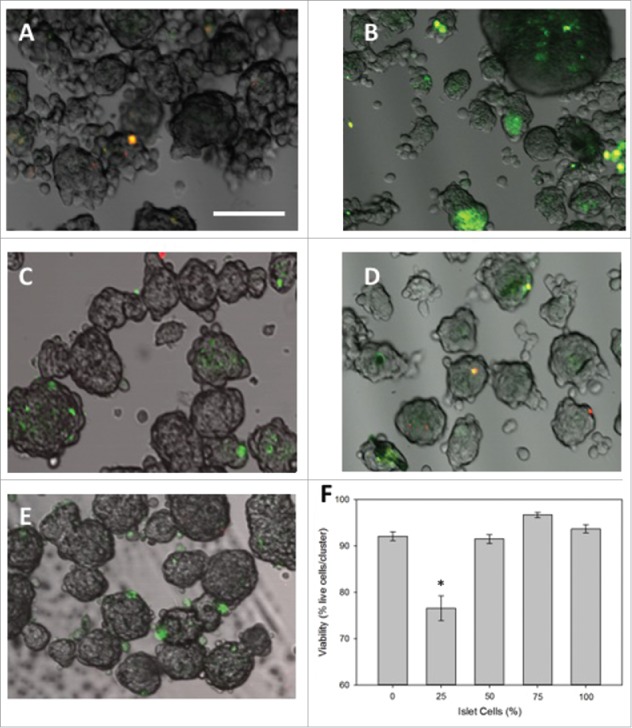
Cell viability. Representative examples of viability results are shown for (A) the 0% group, (B) 25%, (C) 50%, (D) 75%, and (E) 100%. Within 24 hours after removal from the micromolds, the 25% group had the highest percentage of apoptotic cells (green) with some necrotic cells (red or yellow). Scale bar = 100 μm applying to all images. (F) Cell viability was calculated for each group as the area without apoptotic or necrotic cells. The results are summarized in the bar graph. All the groups had high viability, although the 25% group was statistically lower than all other groups. Viability measurements were obtained from 790 – 1972 individual spheroids from 3–4 trials. * indicates p< 0.05.
