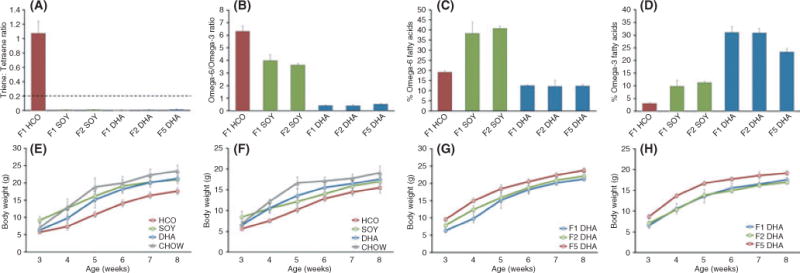
Fig. 4.

Evaluation of safety of the omega-3-rich diet with fatty acid profiles and growth. (A–D) Serum fatty acid profiles over multiple generations (N = 4, 5, 5, 5, 4, 15 for F1 HCO, F1 SOY, F2 SOY, F1 DHA, F2 DHA, and F5 DHA groups, respectively). (A) Serum triene/tetraene ratios demonstrate that no animals on the SOY or DHA diet had evidence of biochemical essential fatty acid deficiency (triene/tetraene ratio > 0.2, horizontal dashed line). (B) Serum omega-6/omega-3 fatty acid ratios and the total percent of fatty acid attributable to (C) omega-6 and (D) omega-3 fatty acids differed significantly between groups. (E–H) Growth data. Weekly average body weight of representative F1 generation (E) males and (F) females from week 3 (wean) to week 8 of life. Weekly body weights did not differ between animals on the CHOW, SOY, and DHA diets but were consistently lower for animals on the HCO diet (N = 5, 11, 7, 5 male and N = 5, 6, 9, 5 female animals for CHOW, HCO, SOY, and DHA diet groups, respectively). Weekly average body weight of representative F1, F2, and F5 generation (G) males and (H) females from week 3 (wean) to week 8 of life. Animals on the DHA diet continued to demonstrate normal growth despite lifelong treatment with this diet over multiple generations (N = 5, 8, 6 male and N = 5, 5, 6 female animals for F1, F2, and F5 DHA groups, respectively). All data represented as mean ± SD.
